campaign
creatives

9 Best Tools For Tracking Marketing Performance That Actually Connect Campaigns To Revenue
Discover the best tools for tracking marketing performance that transform scattered data into actionable insights, helping you prove ROI and optimize spend across all your marketing channels.
You've just spent $50,000 on marketing campaigns across Google Ads, Facebook, email, and content marketing. Your CEO asks a simple question: "Which channels are actually driving revenue?" You open three different dashboards, export data into spreadsheets, and realize your attribution is a mess. Sound familiar?
Modern marketing teams juggle an average of 8-12 different channels, yet most struggle to connect their efforts to actual business outcomes. The challenge isn't generating data—it's transforming that data into actionable insights that drive better decisions.
The right marketing performance tracking tool does more than collect metrics. It connects the dots between your campaigns and revenue, reveals which touchpoints truly influence conversions, and provides the clarity needed to optimize your marketing spend. Whether you're running a lean startup or managing enterprise campaigns, understanding how to measure ROI in digital advertising starts with choosing the right tracking infrastructure.
We've tested dozens of marketing analytics platforms to identify the tools that deliver genuine performance visibility. Here are the leading solutions that excel in different scenarios—from multi-touch attribution specialists to comprehensive analytics suites.
1. Google Analytics 4
Best for: Businesses seeking comprehensive, free analytics with cross-platform tracking capabilities
Google Analytics 4 represents a fundamental shift in how businesses track user interactions across websites and apps, moving from session-based to event-based measurement.

Where This Tool Shines
GA4 excels at providing a unified view of customer journeys across multiple devices and platforms. Unlike Universal Analytics, the platform uses event-based tracking that captures every user interaction as a discrete event with associated parameters. This granular approach reveals behavioral patterns that session-based analytics miss entirely.
The platform's machine learning capabilities automatically surface insights about trending behaviors, potential revenue opportunities, and audience segments likely to convert. For businesses transitioning from Universal Analytics, GA4's predictive metrics help forecast future actions based on historical data patterns, though the learning curve can be steep. The native integration with Google Ads creates seamless connections between advertising spend and website performance, making campaign optimization more straightforward.
Key Features & Capabilities
Cross-Platform Tracking: Follows users across web and mobile app interactions, attempting to connect behavior across devices using various identity signals.
Event-Based Measurement: Captures specific user actions without requiring additional code for common interactions like scrolls, outbound clicks, and video engagement.
Predictive Analytics: Includes purchase probability and churn probability metrics that help identify high-value users early in their journey.
Enhanced Measurement: Automatically tracks scrolls, outbound clicks, site search, video engagement, and file downloads without manual event setup.
Customizable Explorations: Provides advanced analysis capabilities including funnel analysis, path exploration, and cohort analysis for teams comfortable with data analysis.
BigQuery Integration: Connects to Google's data warehouse for advanced analysis, custom reporting, and extended data retention beyond the standard 14-month limit.
Implementation Realities
Setting up GA4 properly requires more than just installing a tracking code. You'll need to configure data streams, set up conversion events that align with your business goals, and establish custom dimensions for business-specific data needs. The enhanced measurement feature captures common interactions automatically, but meaningful insights often require implementing custom events with proper parameter structures.
The platform's interface differs significantly from Universal Analytics, requiring team retraining. The Explorations feature offers powerful analysis capabilities but demands understanding of dimensions, metrics, and segments. Many teams find themselves recreating familiar Universal Analytics reports in GA4's new structure, which takes time and experimentation.
Best For / Ideal Users
GA4 works best for small to enterprise businesses that need comprehensive analytics without licensing costs. It's particularly valuable for content-driven websites where understanding user engagement patterns is critical.
2. HubSpot Marketing Analytics
Best for: Inbound marketing teams needing integrated CRM and marketing performance tracking
HubSpot Marketing Analytics connects your marketing activities directly to revenue outcomes through its native CRM integration, eliminating the data silos that plague most marketing teams.
Where This Tool Shines
HubSpot's greatest strength lies in its ability to track the entire customer lifecycle from anonymous website visitor through closed deal without requiring complex integrations. The platform automatically attributes revenue to specific marketing assets—individual blog posts, email campaigns, social media posts, or paid ads—making budget allocation decisions straightforward rather than speculative.
The attribution reporting includes multiple models (first-touch, last-touch, multi-touch) so you can analyze performance from different perspectives. For teams running inbound strategies, the content analytics reveal which topics and formats drive the most qualified leads, not just traffic volume. This granularity helps content teams focus on what actually converts rather than what simply attracts clicks.
Key Features & Capabilities
Multi-Touch Attribution Reporting: Connects marketing activities to closed revenue across the entire customer journey, showing which touchpoints influenced deals.
Campaign Tracking Across Channels: Monitors performance across email, social media, paid ads, and content in unified dashboards.
Contact Timeline Visualization: Shows every interaction a lead has with your marketing, from first website visit through conversion.
Traffic Analytics with Source Tracking: Captures source, medium, and campaign data automatically for all website visitors.
Custom Report Builder: Creates specific performance dashboards tailored to your team's KPIs and reporting needs.
Revenue Attribution by Asset: Identifies which specific pieces of content, campaigns, and channels generate actual revenue.
Advertising Platform Integration: Connects with major ad platforms for unified reporting without manual data exports.
Best For / Ideal Users
HubSpot Marketing Analytics excels for B2B companies with longer sales cycles where multiple touchpoints influence purchasing decisions. It's particularly valuable when your team already uses HubSpot CRM or marketing tools, as the native integration eliminates data synchronization headaches.
Inbound marketing teams benefit most because the platform tracks content performance at a granular level. Marketing managers who need to prove ROI to executives appreciate the direct connection between marketing activities and closed revenue.
Pricing
Marketing Analytics is included in HubSpot's Marketing Hub Professional ($800/month for 2,000 contacts) and Enterprise ($3,600/month for 10,000 contacts) plans. The Starter plan includes basic analytics but lacks advanced attribution features that make the platform truly valuable.
3. Mixpanel
Best for: Product-led companies tracking user behavior and engagement metrics
Mixpanel specializes in product analytics, helping teams understand how users interact with digital products and which features drive retention.
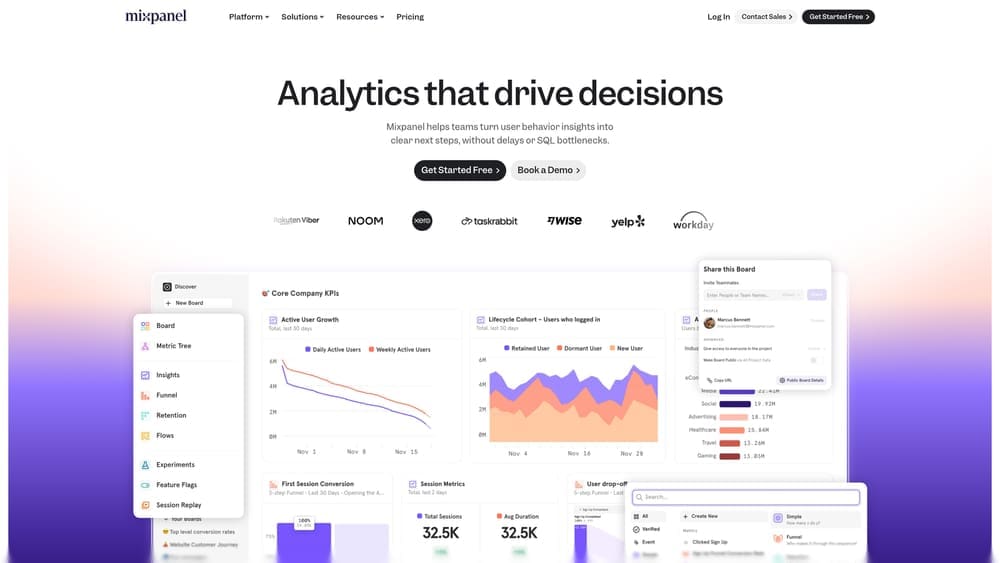
Where This Tool Shines
Mixpanel excels at answering behavioral questions that traditional analytics tools struggle with. The platform tracks individual user actions across sessions, revealing patterns in how people actually use your product rather than just counting pageviews.
The real power emerges when you start asking "which users who did X also did Y?" Cohort analysis shows how different user groups behave over time, while funnel analysis identifies exactly where users drop off in conversion paths. For SaaS companies and mobile apps, this behavioral segmentation provides actionable insights that directly inform product development and marketing optimization decisions.
Key Features & Capabilities
Event-based tracking: Captures specific user actions with custom properties for detailed analysis.
Funnel analysis: Shows conversion rates between any sequence of events you define.
Cohort analysis: Compares user groups based on behavior or acquisition date.
Retention reports: Measures how often users return and which actions correlate with engagement.
User profiles: Shows individual journey history with every action taken.
Best For / Ideal Users
Mixpanel works best for SaaS companies, mobile app developers, and product managers focused on user engagement and retention. It's especially valuable for businesses where product usage directly correlates with revenue—think subscription services, freemium models, or apps with in-app purchases.
Growth teams appreciate how Mixpanel reveals which features drive long-term engagement versus those that users try once and abandon.
Pricing
Mixpanel offers a free tier for up to 20 million events per month. Growth plans start at $25/month (billed annually) with additional features. Enterprise pricing is custom based on volume and requirements.
4. Ruler Analytics
Best for: Marketing teams needing closed-loop attribution connecting campaigns to revenue
Ruler Analytics bridges the gap between marketing data and sales outcomes by tracking the complete customer journey from anonymous visitor to closed customer.
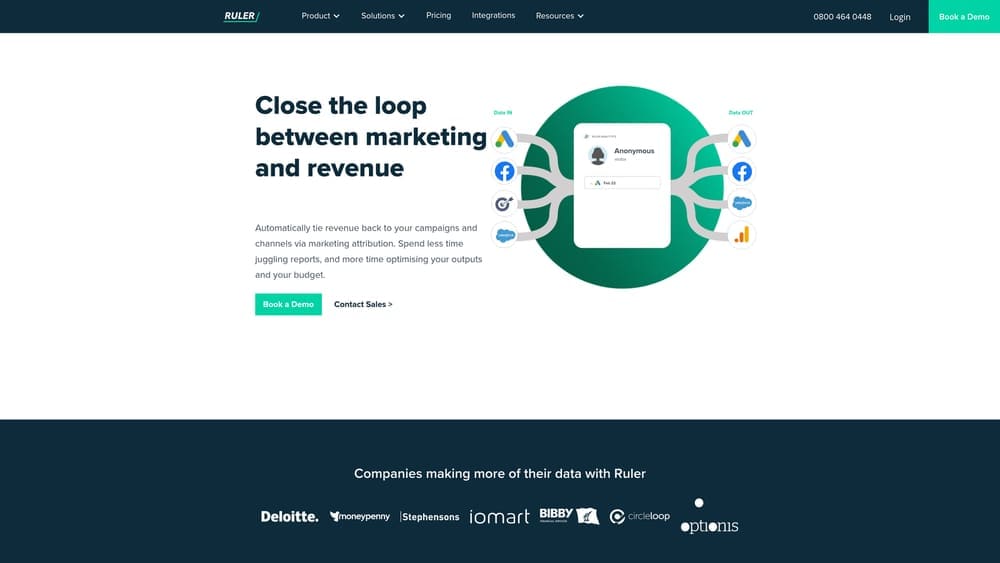
Where This Tool Shines
Ruler's core strength is its ability to track anonymous website visitors through their entire journey, even when they don't convert immediately. The platform captures every touchpoint—from initial ad click through multiple website visits—and connects this data to CRM records when leads convert.
This closed-loop tracking reveals which marketing channels and campaigns actually generate revenue, not just leads. The tool integrates with popular CRMs and marketing platforms, automatically pushing attribution data back to these systems. For agencies and businesses running multi-channel campaigns, Ruler eliminates the attribution guesswork by showing the true customer path to purchase.
Key Features & Capabilities
Call Tracking Integration: Attributes phone conversions to specific marketing sources, capturing a conversion channel many tools miss entirely.
Form Tracking: Connects form submissions to the full visitor journey, showing every touchpoint before conversion.
Multi-Touch Attribution Models: Includes first-click, last-click, linear, and time-decay models for analyzing campaign influence.
CRM Data Enrichment: Automatically enriches lead records with marketing source data, eliminating manual data entry.
Revenue Attribution: Shows which campaigns drive actual sales, not just lead generation metrics.
Consolidated Marketing Dashboard: Brings data from all channels into one view for simplified reporting.
Automated Reporting: Sends scheduled reports to stakeholders without manual compilation work.
Best For / Ideal Users
Ruler Analytics works best for B2B companies with phone sales, where traditional web analytics miss significant conversion activity. The platform is particularly valuable for agencies managing multiple clients who need to prove campaign ROI with clear revenue attribution.
Businesses with longer sales cycles benefit most, as Ruler tracks the complete journey across weeks or months of touchpoints. If you need to prove marketing ROI to executives or clients with concrete revenue data, Ruler provides the closed-loop tracking that standard analytics platforms lack.
Pricing
Ruler Analytics pricing starts around £199/month for basic plans with limited tracking volume. Mid-tier plans range from £499-£999/month depending on features and volume. Enterprise pricing is custom based on specific requirements.
5. Supermetrics
Best for: Marketers consolidating data from multiple platforms into unified reports
Supermetrics automates the process of pulling marketing data from various sources into spreadsheets, data warehouses, or visualization tools.
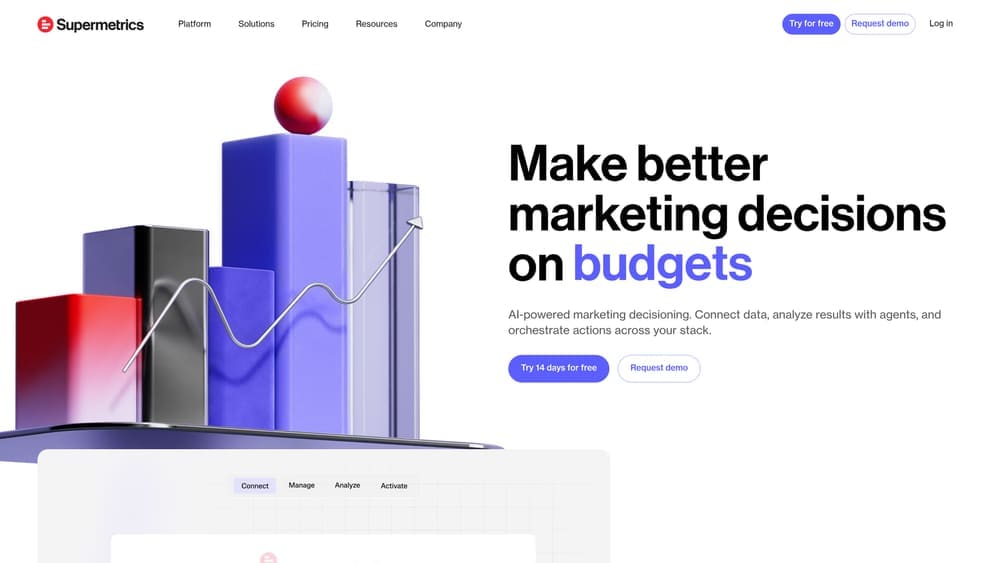
Where This Tool Shines
Supermetrics eliminates the tedious manual work of exporting data from different marketing platforms and combining it for analysis. The platform connects to over 100 data sources including Google Ads, Facebook Ads, LinkedIn, Instagram, and analytics platforms, automatically refreshing your reports with current data.
For teams that live in Google Sheets or Excel, Supermetrics brings all marketing metrics into familiar environments. The platform also feeds data into visualization tools like Google Data Studio, Tableau, and Power BI, enabling custom dashboards that update automatically. This automation saves hours of manual reporting time while reducing errors from copy-paste workflows.
Key Features & Capabilities
100+ Data Source Connectors: Access all major advertising and analytics platforms from a single interface.
Automated Data Refresh: Schedule updates on your preferred cadence, from hourly to monthly.
Multiple Destination Options: Send data directly to Google Sheets, Excel, Google Data Studio, or BI tools.
Custom Metrics and Calculated Fields: Create advanced analysis without leaving your spreadsheet.
Historical Data Backfill: Pull past performance data for trend analysis and year-over-year comparisons.
Multi-Account Support: Agencies can manage client data across separate accounts efficiently.
Best For / Ideal Users
Supermetrics works best for agencies managing multiple client accounts who need consistent reporting across different businesses. Marketing teams running campaigns across many platforms benefit from the centralized data access.
Data analysts who need centralized reporting without building custom API integrations find Supermetrics particularly valuable. Teams already comfortable with spreadsheets or BI tools can leverage existing skills rather than learning new analytics platforms.
Pricing
Pricing varies by destination platform. Google Sheets plans start at $19/month per user. Data Studio connectors begin at $99/month. BigQuery and data warehouse connectors start around $239/month. Enterprise plans with advanced features use custom pricing.
6. Improvado
Best for: Enterprise marketing teams requiring automated data pipeline and transformation
Improvado provides an enterprise-grade marketing data platform that extracts, transforms, and loads data from hundreds of sources into your analytics infrastructure.
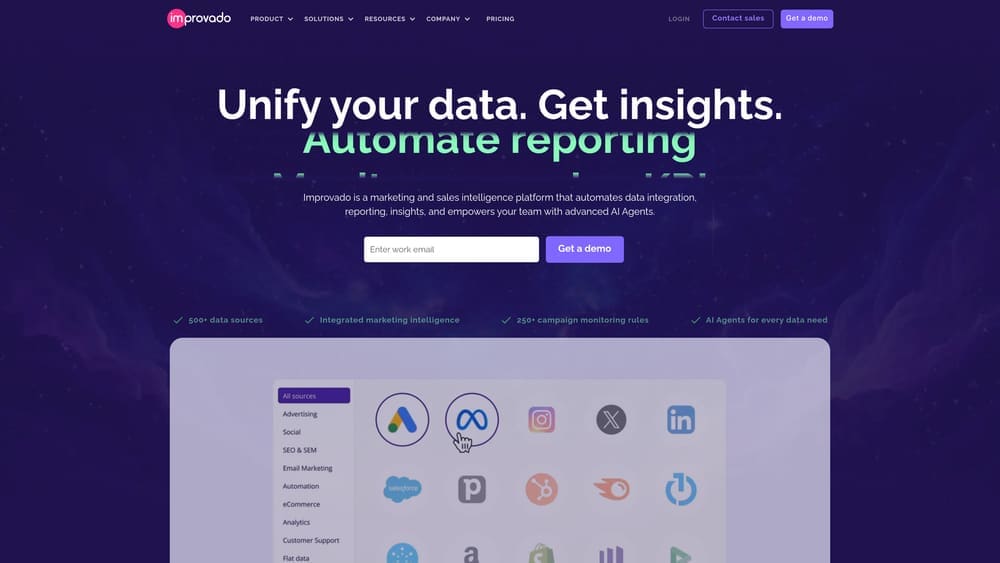
Where This Tool Shines
Improvado handles the complex data engineering work that typically requires dedicated technical resources. The platform automatically normalizes data from different sources, resolving naming inconsistencies and format differences that plague manual reporting.
Unlike simpler connectors, Improvado includes sophisticated transformation capabilities that clean and prepare data for analysis without requiring SQL knowledge. The platform's data governance features ensure consistency across reports while maintaining security and compliance requirements. For large marketing teams with complex tech stacks, Improvado eliminates data silos by creating a single source of truth for all marketing performance metrics.
Key Features & Capabilities
500+ Pre-Built Connectors: Access data from major advertising platforms, social media, analytics tools, and CRM systems without custom development.
Automated Data Transformation: The platform standardizes metrics, currency conversions, and naming conventions across different data sources automatically.
Real-Time and Scheduled Syncs: Choose between continuous data updates or scheduled refreshes based on your reporting needs and data volume.
Data Warehouse Integration: Native connections to Snowflake, BigQuery, Redshift, and other enterprise data warehouses enable advanced analysis.
Marketing Common Data Model: Standardized schema ensures consistent metric definitions across all marketing channels and campaigns.
Cross-Channel Attribution: Built-in attribution modeling and marketing mix capabilities connect spending to outcomes across channels.
Dedicated Support: Enterprise customers receive custom connector development and dedicated technical support for complex implementations.
Best For / Ideal Users
Improvado is built for enterprise marketing teams managing substantial advertising budgets across multiple platforms. The tool makes most sense when you're spending six figures monthly on marketing and need reliable data infrastructure.
Large agencies managing dozens of client accounts benefit from Improvado's ability to standardize reporting across different client tech stacks. Companies with dedicated analytics or business intelligence teams who need clean, reliable data for advanced analysis will appreciate the platform's transformation capabilities.
The tool particularly suits organizations where marketing data feeds executive dashboards or powers automated decision-making systems. If your team currently employs data engineers to build and maintain marketing data pipelines, Improvado can replace much of that custom development work.
Pricing
Improvado uses custom enterprise pricing based on data volume, number of connectors, and specific requirements. Typical implementations start around $2,000 monthly and scale based on complexity and usage. The platform targets mid-market to enterprise organizations with substantial marketing operations.
7. Segment
Best for: Technical teams building custom analytics infrastructure with flexible data routing
Segment provides a customer data platform that collects user interactions once and routes that data to any analytics, marketing, or data warehouse tool you choose.
Where This Tool Shines
Segment's architecture solves a problem that plagues most growing companies: implementing and maintaining tracking code for every new tool you want to test. Instead of adding Facebook Pixel, then Google Analytics, then Mixpanel, then your email platform's tracking—each requiring developer time—you implement Segment once. From there, marketing teams can activate new destinations through Segment's interface without touching code.
This "collect once, send everywhere" approach becomes increasingly valuable as your marketing stack grows. When you want to test a new analytics platform or add a marketing automation tool, you simply toggle it on in Segment's dashboard. The platform immediately starts sending your existing event data to the new destination. This flexibility lets you experiment with tools without the usual implementation friction that kills most testing initiatives.
Key Features & Capabilities
Single API Implementation: One tracking library captures data across web, mobile, and server-side sources, eliminating redundant code.
300+ Pre-Built Integrations: Connect to analytics platforms, marketing tools, data warehouses, and CRM systems without custom development.
Real-Time Data Streaming: Events flow to destinations immediately, enabling real-time personalization and triggered campaigns.
Data Warehouse Syncs: Send raw event data to Snowflake, BigQuery, or Redshift for custom analysis beyond packaged tool capabilities.
Schema Validation: Define expected event structures and catch tracking errors before they corrupt your analytics.
Identity Resolution: Connect user behavior across devices and platforms using multiple identity signals.
Privacy Controls: Manage consent and data governance centrally rather than configuring each tool individually.
Best For / Ideal Users
Segment works best for technology companies and SaaS businesses with engineering resources who value flexibility in their analytics stack. Product teams that frequently experiment with new tools benefit significantly from the implementation efficiency.
The platform particularly suits companies sending data to data warehouses for custom analysis, as Segment handles the complex ETL work automatically. If your team regularly asks questions that packaged analytics tools can't answer, Segment's warehouse syncs enable the custom analysis you need.
Pricing
Segment offers a free tier supporting up to 1,000 monthly tracked users. Team plans start at $120/month for 10,000 users. Business plans with advanced features begin around $1,000/month. Enterprise pricing scales based on volume and specific requirements.
8. Amplitude
Best for: Product and growth teams focused on user behavior analysis and experimentation
Amplitude specializes in product analytics, helping teams understand how users interact with digital products and which behaviors predict long-term engagement.
Where This Tool Shines
Amplitude excels at answering the "why" questions that traditional analytics tools struggle with. The platform's Pathfinder feature visualizes the most common routes users take through your product, often revealing unexpected navigation patterns that highlight optimization opportunities. Unlike tools that simply count page views, Amplitude tracks behavioral sequences—showing not just what users did, but the order in which they did it.
The retention analysis goes deeper than basic metrics by correlating specific actions with long-term engagement. You can identify which features, when used within the first week, predict users who'll still be active three months later. This behavioral correlation helps product teams prioritize development efforts based on actual retention impact rather than assumptions.
Key Features & Capabilities
Behavioral Cohort Analysis: Compare user groups based on actions taken rather than just demographics, revealing which behaviors correlate with conversion or churn.
Pathfinder Visualization: Maps the most common user journeys through your product, highlighting drop-off points and unexpected navigation patterns.
Retention Analysis: Measures how often users return and which specific actions drive sustained engagement over time.
Funnel Analysis: Tracks conversion rates between any sequence of events with detailed breakdown of where users abandon the process.
Experimentation Framework: Built-in A/B testing capabilities let you measure feature impact on key behavioral metrics.
Predictive Analytics: Machine learning models identify users likely to convert or churn based on behavioral patterns.
Best For / Ideal Users
Amplitude works best for product managers optimizing feature adoption, growth teams focused on activation and retention metrics, and mobile app developers where engagement directly impacts monetization. The platform is particularly valuable for SaaS businesses and subscription services where understanding the path from signup to active user determines revenue success.
Pricing
Amplitude offers a free Starter plan supporting up to 10 million events monthly. Growth plans with advanced features use custom pricing based on volume. Enterprise plans include additional capabilities like predictive analytics and dedicated support with pricing tailored to specific requirements.
9. Whatagraph
Best for: Agencies and marketing teams needing automated client reporting and dashboards
Whatagraph transforms scattered marketing data into professional visual reports through automated data collection and customizable templates.
Where This Tool Shines
Whatagraph eliminates the tedious manual work that consumes hours each week—copying data from different platforms, formatting spreadsheets, and creating client presentations. The platform automatically pulls metrics from your advertising accounts, social media channels, and analytics tools into pre-designed report templates that actually look professional. For agencies juggling multiple clients, the white-labeling capabilities let you brand every report with your logo, colors, and custom domains, maintaining brand consistency across all client communications.
The automated scheduling feature represents the real time-saver. Set up a report once, and Whatagraph sends updated versions to stakeholders automatically—weekly, monthly, or whatever cadence you choose. Clients receive current performance data without you lifting a finger, and the visual dashboard format makes metrics accessible even to stakeholders who aren't data experts.
Key Features & Capabilities
50+ Native Integrations: Direct connections to major platforms including Google Ads, Facebook, Instagram, LinkedIn, Google Analytics, and email marketing tools.
Drag-and-Drop Report Builder: Customize templates or build reports from scratch using visual widgets for charts, tables, and metrics.
Cross-Channel Performance View: Combine data from multiple sources into single reports showing unified campaign performance.
Automated Report Delivery: Schedule reports to send automatically via email or provide clients with live dashboard access.
White-Label Customization: Add your agency branding, custom domains, and personalized report styling.
Historical Data Storage: Access past performance data even after platform APIs limit historical access.
Best For / Ideal Users
Whatagraph works best for digital marketing agencies managing multiple client accounts who need to deliver professional reports consistently. In-house marketing teams running campaigns across numerous platforms will appreciate the time savings from automated data consolidation.
The platform particularly suits teams who spend significant time on manual reporting rather than strategy and optimization. If your current process involves exporting data from five different platforms and assembling it in PowerPoint, Whatagraph directly addresses that pain point.
Pricing
Whatagraph's Professional plan starts at $223/month for up to 10 data sources and 5 users. Premium plans begin at $335/month with additional sources and advanced features. Custom enterprise pricing is available for larger agencies with extensive reporting needs.
Making the Right Choice
The right tracking tool depends entirely on your specific situation. If you're just starting out or need comprehensive analytics without budget constraints, Google Analytics 4 provides powerful capabilities despite its learning curve. For B2B teams that need to connect marketing activities directly to closed revenue, HubSpot or Ruler Analytics deliver the attribution clarity that justifies marketing spend to executives.
Product-led companies and SaaS businesses will find more value in behavioral analytics platforms like Mixpanel or Amplitude, which reveal how users actually engage with your product rather than just tracking website visits. If your challenge is consolidating data from multiple platforms, Supermetrics offers the quickest path to unified reporting, while Improvado handles enterprise-scale data complexity that smaller tools can't manage.
Start by identifying your primary pain point. Are you struggling to prove ROI? Choose attribution-focused tools. Need to understand user behavior? Go with product analytics. Drowning in manual reporting? Pick a data consolidation platform. Most importantly, consider your team's technical capabilities and the time you can invest in implementation—the most powerful tool is worthless if your team can't use it effectively.
The marketing landscape will only get more complex, but the right tracking infrastructure transforms that complexity into competitive advantage. Take the time to evaluate which tool aligns with your business model, sales cycle, and team capabilities. Your future self—and your CEO—will thank you when you can confidently answer that revenue attribution question.
Campaign
Creatives
quick links
contact
© 2025 Campaign Creatives.
All rights reserved.