campaign
creatives

8 Best Analytics Software Tools To Maximize ROI
Discover the top analytics software platforms that transform raw data into actionable insights, helping businesses predict customer behavior, optimize campaigns in real-time, and unlock revenue growth in 2026.
Your business is drowning in data. Every click, every purchase, every abandoned cart generates another data point that could unlock growth—but only if you know how to read it. Most companies collect mountains of information and then make decisions based on hunches, leaving millions in potential revenue on the table.
The businesses winning in 2026 aren't guessing. They're using analytics software to predict customer behavior, optimize campaigns in real-time, and spot opportunities their competitors miss entirely. The difference between stagnant growth and explosive scaling often comes down to one thing: turning raw data into decisions that actually move the needle.
But here's where it gets tricky. The analytics software market is packed with hundreds of tools, each promising to be your data salvation. Some excel at web analytics, others specialize in user behavior tracking, and many claim to do everything while delivering mediocre results across the board.
This guide cuts through the noise. We've analyzed the leading analytics platforms transforming how businesses understand their customers, from enterprise giants trusted by Fortune 500 companies to specialized tools designed for specific use cases. Here are the top analytics software solutions that deliver actionable insights, not just pretty dashboards.
1. Google Analytics 4
Best for: Comprehensive website and app analytics with advanced machine learning insights
Google Analytics 4 represents the evolution of the world's most popular analytics platform, delivering cross-platform tracking and AI-powered insights that help businesses understand complete customer journeys.
Where This Tool Shines
GA4 fundamentally reimagines how businesses track digital interactions by moving from session-based to event-based measurement. This shift means you're no longer limited to pageviews—every scroll, click, video play, and form interaction becomes a trackable event that reveals actual user engagement patterns.
The platform's machine learning capabilities work behind the scenes to surface insights you might miss. It automatically identifies trending searches, predicts which users are likely to convert or churn, and highlights anomalies in your data that warrant investigation. For businesses juggling both websites and mobile apps, GA4's unified tracking eliminates the fragmented view that plagued previous analytics approaches.
Key Features & Capabilities
Cross-Platform Journey Tracking: Follow users seamlessly across your website, iOS app, and Android app using a single property, finally understanding how customers move between platforms before converting.
Predictive Metrics: Built-in machine learning calculates purchase probability, churn probability, and predicted revenue for user segments without requiring data science expertise.
Enhanced Measurement: Automatically tracks scrolls, outbound clicks, site searches, video engagement, and file downloads without additional code implementation.
Exploration Reports: Create custom analyses using funnel exploration, path exploration, segment overlap, and cohort analysis tools that go far beyond standard reports.
BigQuery Integration: Export raw, unsampled data to Google's data warehouse for advanced analysis, SQL queries, and integration with business intelligence tools—available even on the free tier.
Privacy-Centric Design: Cookieless measurement options, automatic IP anonymization, and data retention controls help businesses navigate evolving privacy regulations while maintaining analytical capabilities.
Google Ads Synchronization: Seamlessly share audiences and conversion data with Google Ads for remarketing campaigns and attribution analysis that connects ad spend to actual business outcomes.
Best For / Ideal Users
GA4 serves businesses at every stage, from startups tracking their first users to enterprises analyzing millions of daily interactions. It's particularly valuable for companies with both web and mobile presence who need unified customer journey visibility.
Ecommerce businesses benefit from enhanced tracking that monitors product views, cart additions, and purchase completions across platforms. Marketing teams appreciate the direct integration with Google's advertising ecosystem, enabling closed-loop attribution from ad impression to final conversion.
Organizations prioritizing data ownership and advanced analysis capabilities leverage the free BigQuery export to build custom data warehouses and create sophisticated analyses beyond GA4's interface limitations.
Pricing
Google Analytics 4 is free for most businesses, with no limits on standard features or data collection volume. Google Analytics 360 serves enterprise clients requiring unsampled data access, advanced attribution models, dedicated support, and service level agreements, with pricing starting at $150,000 annually based on hit volume and feature requirements.
2. Adobe Analytics
Best for: Enterprise-level analytics with advanced segmentation and real-time personalization capabilities
Adobe Analytics delivers sophisticated data analysis capabilities designed for large organizations managing complex digital ecosystems across multiple channels and touchpoints.
Where This Tool Shines
Adobe Analytics separates itself through its Analysis Workspace—a flexible canvas that lets analysts build custom reports without technical limitations. Unlike rigid dashboard systems, this workspace approach means you can drag, drop, and manipulate data visualizations on the fly during stakeholder meetings.
The platform processes data in real-time, which matters when you're running high-stakes campaigns or managing flash sales. You're not waiting for overnight batch processing to understand what's happening right now. This immediacy extends to its segmentation engine, which handles unlimited custom segments without performance degradation—a critical advantage when analyzing enterprise-scale data volumes.
Key Features & Capabilities
Advanced Segmentation Engine: Create unlimited custom segments based on any combination of behaviors, demographics, or custom variables without impacting query performance.
Real-Time Data Streaming: Process and visualize data as events occur, enabling immediate response to emerging trends or issues.
Multi-Touch Attribution: Understand the true impact of each marketing touchpoint with customizable attribution models that reflect your actual customer journey.
Predictive Analytics: Machine learning algorithms automatically detect anomalies and forecast future trends based on historical patterns.
Calculated Metrics: Build custom metrics using mathematical formulas and logic, creating business-specific KPIs beyond standard analytics measurements.
API Access: Extract data programmatically for custom integrations, automated reporting, or feeding data warehouses.
Best For / Ideal Users
Adobe Analytics serves large enterprises with substantial web traffic—typically organizations processing millions of monthly server calls. Companies with dedicated analytics teams benefit most, as the platform's depth requires expertise to unlock its full potential.
Organizations already invested in Adobe Experience Cloud gain particular value through native integrations with Adobe Target for personalization, Adobe Audience Manager for segmentation, and Adobe Campaign for marketing automation.
Pricing
Adobe Analytics uses custom pricing based on server call volume and feature requirements. Mid-market implementations typically start around $48,000 annually, with enterprise packages reaching six figures depending on scale and complexity.
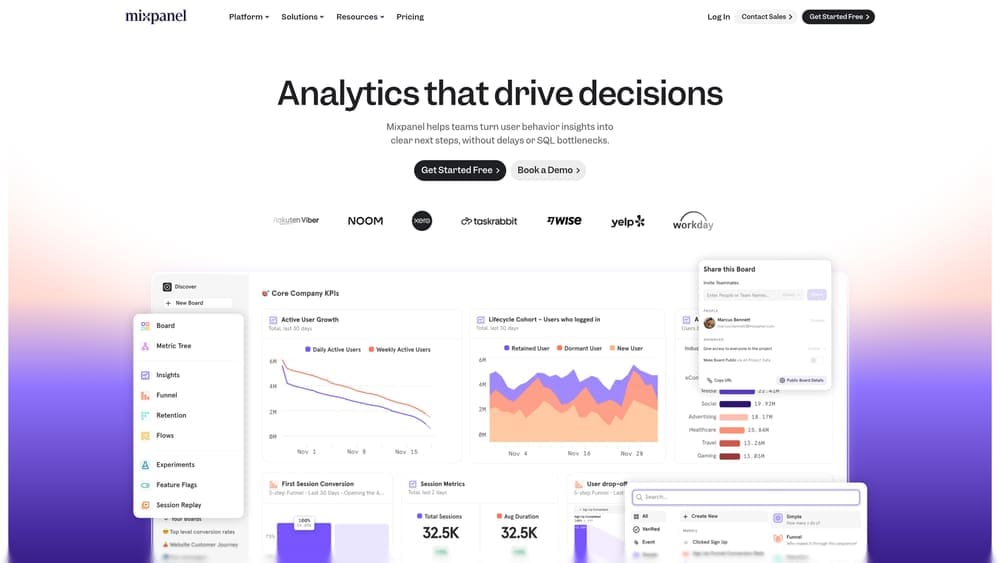
3. Mixpanel
Best for: Product analytics and user behavior tracking with powerful cohort analysis
Mixpanel is a product analytics platform that provides a complete view of customers through digital analytics, enabling teams to track, analyze, and act on user behavior to drive acquisition, growth, and retention.
Where This Tool Shines
Mixpanel excels at tracking specific user actions rather than just pageviews, making it invaluable for understanding how people actually interact with your product. Its event-based tracking model captures every button click, feature usage, and user interaction, providing granular insights into behavior patterns that traditional analytics miss.
The platform's cohort analysis capabilities reveal how different user groups behave over time, showing exactly which features drive retention and which cause drop-off. This behavioral segmentation helps product teams prioritize development efforts based on actual usage data rather than assumptions. Mixpanel's real-time processing means you can spot trends and anomalies as they happen, enabling immediate response to user behavior changes.
Key Features & Capabilities
Event-Based Tracking: Capture every user interaction with flexible event properties and custom parameters for detailed behavioral analysis.
Cohort Analysis: Group users by behavior or attributes to understand retention patterns and engagement trends across different segments.
Funnel Analysis: Visualize step-by-step conversion processes to identify exactly where users drop off and optimize critical paths.
User Journey Mapping: Track complete paths users take through your product to discover unexpected usage patterns and optimization opportunities.
Real-Time Alerts: Receive notifications when significant metric changes occur, enabling immediate investigation and response.
Best For / Ideal Users
Mixpanel is designed for teams that move fast and need to make data-driven decisions quickly. It's particularly valuable for SaaS companies tracking feature adoption, mobile app developers optimizing user engagement, and product managers focused on activation and retention metrics.
The platform works best for businesses with freemium models or subscription services where understanding the path from signup to active user is critical. Growth teams appreciate its ability to connect user behavior directly to revenue outcomes.
Pricing
Mixpanel offers a free tier for up to 20 million events monthly, making it accessible for startups and growing businesses. Paid plans start at $25 per month for additional features and higher event volumes, with enterprise pricing available for larger organizations requiring advanced capabilities.
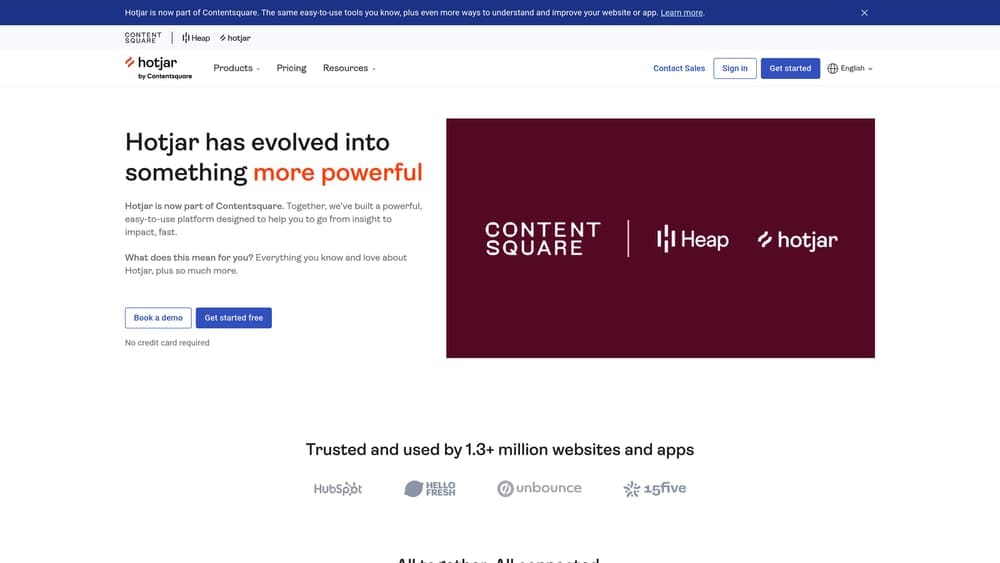
4. Hotjar
Best for: User experience analytics with heatmaps, session recordings, and feedback collection
Hotjar is a behavior analytics platform that shows you exactly how visitors interact with your website through visual tools like heatmaps and session recordings.
Where This Tool Shines
Hotjar bridges the gap between quantitative analytics and qualitative understanding. While traditional analytics tell you that users are leaving your checkout page, Hotjar shows you the exact moment they hesitate, where their cursor hovers in confusion, and how far they scroll before abandoning the process.
The platform's visual approach makes complex user behavior instantly understandable. Heatmaps reveal click patterns, scroll depth, and mouse movement in colorful overlays that anyone on your team can interpret without analytics expertise. Session recordings function like watching over someone's shoulder as they navigate your site, exposing usability issues that numbers alone never reveal.
Key Features & Capabilities
Visual Heatmaps: Click, move, and scroll heatmaps show where users focus attention and interact most frequently.
Session Recordings: Watch real user sessions to identify friction points, confusion, and unexpected behavior patterns.
Feedback Widgets: Collect direct user input through on-site surveys and feedback tools at critical moments.
Conversion Funnels: Visualize drop-off points in your conversion process with combined quantitative and qualitative data.
Form Analytics: See which form fields cause hesitation, which get abandoned, and where users spend the most time.
Best For / Ideal Users
Hotjar is perfect for UX designers who need to validate design decisions with real user behavior data. Conversion rate optimizers rely on it to identify exactly where landing pages lose visitors.
Marketing teams use Hotjar to understand why campaigns drive traffic but not conversions. E-commerce businesses find it invaluable for optimizing product pages and checkout flows.
Small to mid-sized businesses appreciate that Hotjar doesn't require technical implementation expertise—you can start gathering insights within minutes of installation.
Pricing
Hotjar offers a free plan with basic features for one website. Paid plans start at $32 per month, scaling based on daily sessions captured and number of heatmaps stored.
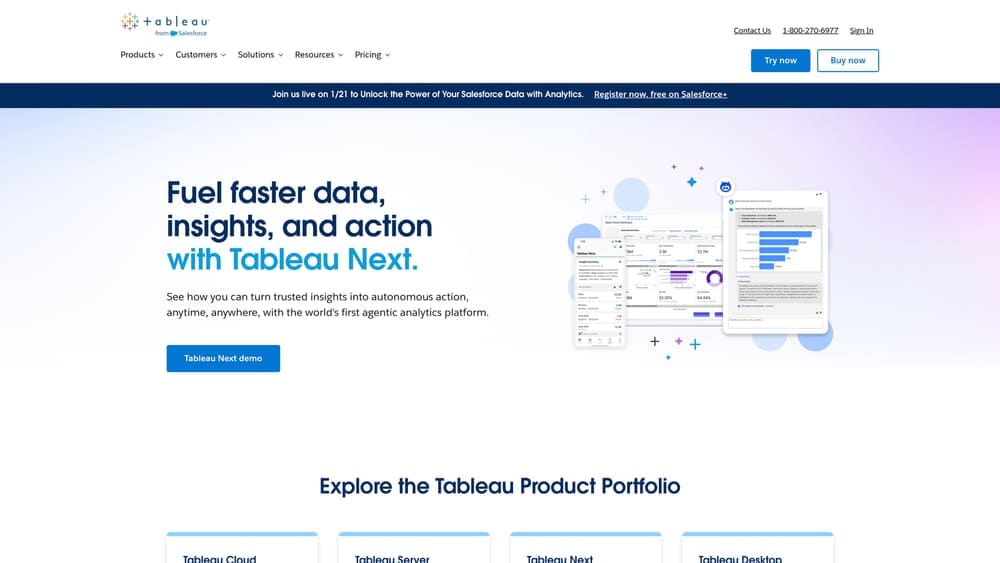
5. Tableau
Best for: Advanced data visualization and business intelligence with powerful dashboard creation
Tableau transforms complex datasets into interactive visualizations that make sophisticated analysis accessible to everyone in your organization.
Where This Tool Shines
Tableau excels at turning overwhelming spreadsheets and database queries into visual stories that anyone can understand. Its drag-and-drop interface democratizes data analysis, allowing marketing managers, executives, and operations teams to explore data without writing SQL queries or pestering the IT department.
The platform's real power emerges when connecting multiple data sources. You can pull customer data from your CRM, website traffic from Google Analytics, sales figures from your ERP system, and social media metrics from various platforms—then create unified dashboards showing how everything connects. This cross-functional visibility reveals insights that remain hidden when data lives in separate silos.
Key Features & Capabilities
Visual Analytics Engine: Create everything from basic bar charts to complex heat maps and geographic visualizations using intuitive drag-and-drop controls.
Live Data Connections: Connect directly to databases, cloud services, and spreadsheets with real-time updates reflecting current business conditions.
Interactive Dashboards: Build dashboards where users can filter, drill down, and explore data dynamically without creating new reports.
Statistical Analysis Tools: Perform trend analysis, forecasting, and clustering analysis without advanced statistical knowledge.
Mobile Optimization: Access fully functional dashboards on tablets and smartphones with touch-optimized interfaces.
Collaboration Features: Share dashboards across teams, add comments directly on visualizations, and subscribe to automated report delivery.
Best For / Ideal Users
Tableau serves data analysts and business intelligence teams who need to create sophisticated visualizations quickly. It's particularly valuable for organizations where multiple departments need access to data insights but lack technical expertise to query databases directly.
Companies with data scattered across various systems benefit most—those pulling information from CRMs, ERPs, marketing platforms, and financial systems into cohesive analytical views. Finance teams use it for budget variance analysis, sales teams for pipeline visualization, and marketing teams for campaign performance tracking.
Pricing
Tableau Creator licenses start at $75 per user monthly for full authoring capabilities. Explorer licenses cost $42 monthly for interactive dashboard access with limited editing. Viewer licenses run $15 monthly for dashboard consumption only.
6. Amplitude
Best for: Product analytics with advanced user journey mapping and behavioral cohort analysis
Amplitude is a digital analytics platform that helps product teams build better products by turning user data into meaningful insights through AI-powered analytics and experimentation tools.
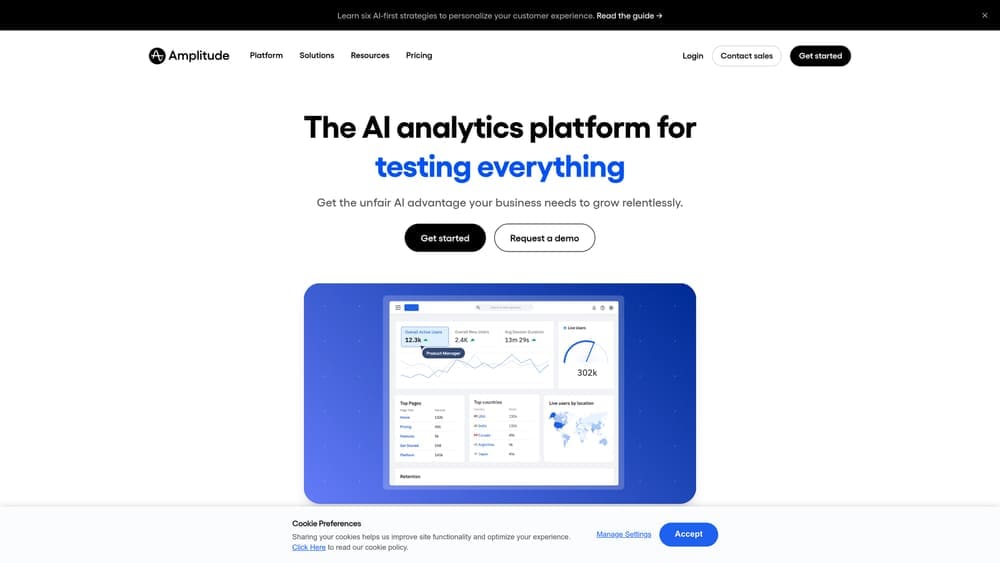
Where This Tool Shines
Amplitude excels at revealing the hidden patterns in how users actually interact with digital products. While traditional analytics tell you what happened, Amplitude shows you why certain users succeed while others abandon your product entirely.
The platform's behavioral cohort analysis tracks how different user groups evolve over time, revealing which onboarding experiences lead to long-term engagement and which features correlate with churn. Its AI-guided analytics automatically surfaces significant behavior changes and anomalies, alerting teams to opportunities or problems before they become critical.
Key Features & Capabilities
Advanced User Journey Mapping: Visualize complex paths users take through your product, identifying common routes to conversion and unexpected drop-off points.
Behavioral Cohort Analysis: Group users by actions they've taken and track how these cohorts perform over time, revealing which behaviors predict retention.
AI-Powered Insights: Machine learning algorithms automatically detect significant changes in user behavior and highlight patterns worth investigating.
Feature Experimentation Tools: Test product changes with built-in A/B testing capabilities that integrate directly with your analytics data.
Session Replay: Watch actual user sessions to understand friction points and usability issues that quantitative data alone can't reveal.
Revenue Analytics: Connect user behaviors directly to business outcomes, showing which product interactions drive the most value.
Guides and Surveys: Collect qualitative feedback from users at critical moments in their journey to complement behavioral data.
Best For / Ideal Users
Amplitude is perfect for product managers who need to prioritize feature development based on actual usage data rather than assumptions. Growth teams will appreciate the platform's ability to identify which user behaviors predict long-term value, enabling more effective acquisition targeting.
SaaS companies with freemium models benefit particularly from Amplitude's conversion funnel analysis and feature adoption tracking. Mobile app developers gain visibility into cross-platform user journeys and can optimize experiences based on device-specific behavior patterns.
Data-driven organizations that have moved beyond basic web analytics and need sophisticated product intelligence will find Amplitude's depth matches their analytical maturity.
Pricing
Amplitude offers a generous free tier supporting up to 10 million events monthly, making it accessible for growing products. Paid plans start at $61 per month for additional features and higher event volumes, with enterprise pricing available for organizations requiring advanced capabilities and dedicated support.
7. Kissmetrics
Best for: Customer analytics focused on individual user tracking and lifetime value optimization
Kissmetrics provides person-based analytics that track individual customer journeys from first touch to conversion and beyond.
Where This Tool Shines
Kissmetrics distinguishes itself by focusing on individual customer tracking rather than anonymous sessions. This person-centric approach enables businesses to understand complete customer lifecycles, from initial awareness through repeat purchases.
The platform excels at attribution modeling across multiple touchpoints and devices, providing clear insights into which marketing efforts drive the most valuable customers. Its cohort analysis capabilities help businesses optimize for customer lifetime value rather than just immediate conversions, making it particularly powerful for subscription-based models and businesses with repeat purchase cycles.
Key Features & Capabilities
Person-Based Tracking: Follows individual users across devices and sessions, maintaining identity even when customers switch between mobile and desktop.
Customer Lifetime Value Analysis: Calculates and tracks CLV metrics to identify your most valuable customer segments and acquisition channels.
Multi-Touch Attribution: Maps complete customer journeys across all marketing touchpoints to understand which channels deserve credit for conversions.
Behavioral Email Automation: Triggers targeted email campaigns based on specific user actions and engagement patterns.
Revenue Tracking: Connects user behavior directly to transaction data for detailed revenue analysis and forecasting.
Best For / Ideal Users
Kissmetrics is ideal for ecommerce businesses tracking customer purchase patterns and repeat behavior. Subscription services benefit from its retention analysis and churn prediction capabilities.
Companies with longer sales cycles requiring detailed customer journey analysis will find its multi-touch attribution particularly valuable. It's especially powerful for businesses focused on customer lifetime value optimization rather than just acquisition metrics.
Pricing
Kissmetrics pricing starts at $299 per month for their Silver plan, with higher tiers available based on data volume and feature requirements.
8. Segment
Best for: Customer data platform that unifies data collection and distribution across marketing tools
Segment functions as the central data infrastructure that eliminates the headache of implementing tracking codes across dozens of different marketing and analytics platforms.
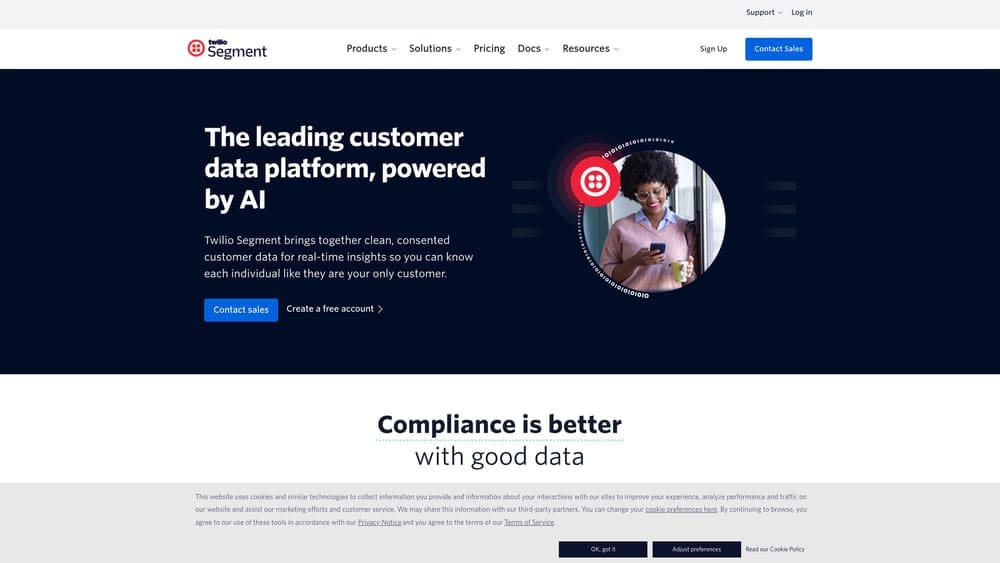
Where This Tool Shines
Segment solves a problem that becomes painfully obvious as your marketing stack grows: every new tool requires its own tracking implementation. Add Google Analytics, implement their code. Add Mixpanel, implement another snippet. Add HubSpot, Facebook Pixel, Intercom—suddenly your developers are drowning in tracking requests while your website performance suffers from code bloat.
Segment changes this entirely. You implement Segment once, and it becomes your single source of truth for customer data. From there, you can route that data to hundreds of destinations with simple toggle switches—no additional code required. When you want to test a new analytics tool or add a marketing platform, you flip it on in Segment's interface rather than bothering your development team.
Key Features & Capabilities
Single API Implementation: One tracking code captures all customer interactions across web, mobile, and server-side sources.
Real-Time Data Streaming: Customer data flows instantly to connected destinations, enabling immediate personalization and automation.
Data Quality Controls: Built-in validation ensures consistent data formatting and catches tracking errors before they corrupt your analytics.
Privacy Management: Centralized consent controls help maintain GDPR and CCPA compliance across all connected tools.
Customer Profile Unification: Combines data from multiple touchpoints into unified customer profiles accessible across your entire stack.
Best For / Ideal Users
Segment is perfect for growing companies managing five or more marketing and analytics tools who are tired of coordinating tracking implementations. Development teams appreciate the reduced engineering burden, while marketing teams gain flexibility to experiment with new tools without technical dependencies.
It's particularly valuable for businesses with both web and mobile applications requiring consistent tracking, companies prioritizing data quality and governance, and organizations where multiple teams need access to customer data in their preferred tools.
Pricing
Segment offers a free tier supporting up to 1,000 monthly tracked users, making it accessible for startups testing the platform. Team plans start at $120 per month, while Business plans with advanced features use custom pricing based on data volume and destination requirements.
Putting It All Together
The right analytics software transforms your business from reactive to proactive. Google Analytics 4 remains the go-to starting point for most businesses—comprehensive, free, and powerful enough to handle complex tracking needs. For teams obsessed with user experience, Hotjar's visual insights reveal exactly where your website frustrates or delights visitors. Product teams building SaaS applications will find Mixpanel or Amplitude indispensable for understanding feature adoption and user retention patterns.
Your choice ultimately depends on three factors: what you're measuring, who's analyzing the data, and how you'll act on insights. Ecommerce businesses benefit from GA4's conversion tracking paired with Hotjar's behavioral insights. Enterprise organizations with dedicated analytics teams should explore Adobe Analytics or Tableau for advanced capabilities. Companies managing multiple marketing tools will appreciate Segment's unified data infrastructure.
Start with one platform that addresses your most pressing analytics gap. Master it thoroughly before expanding your stack. The businesses seeing the biggest returns aren't using every tool—they're using the right tools consistently and acting on what they discover.
Ready to transform your marketing data into growth? Learn more about our services and discover how we help businesses build data-driven marketing strategies that deliver measurable results.
Campaign
Creatives
quick links
contact
© 2025 Campaign Creatives.
All rights reserved.