campaign
creatives

7 Best Marketing Performance Benchmarks By Industry Tools To Stop Guessing And Start Winning
Discover seven specialized tools that provide marketing performance benchmarks by industry, giving you the competitive context needed to make confident budget decisions and identify real opportunities in your market.
You're staring at your marketing dashboard, wondering if that 2.3% conversion rate is good or terrible. Your CEO asks how your email open rates compare to competitors. Your CMO wants to know if your social engagement justifies the budget. Without industry-specific benchmarks, you're flying blind—making decisions based on gut feel rather than data.
The challenge isn't just tracking metrics. It's knowing what "good" looks like in your specific industry. A 15% email open rate might be excellent for B2B SaaS but concerning for e-commerce. A $50 cost per lead could be a bargain in enterprise software but unsustainable for consumer products.
That's where specialized benchmarking tools come in. These platforms aggregate real performance data across thousands of companies, segmented by industry, company size, and channel. Instead of guessing whether your paid search CTR is competitive, you can see exactly where you stand against similar businesses.
The right benchmarking tool transforms your marketing reporting from "here's what we did" to "here's how we're performing against the market." It helps you identify genuine opportunities and real problems, giving you the context to make confident budget allocation decisions backed by industry data.
Here are seven tools that provide real competitive context for your marketing metrics.
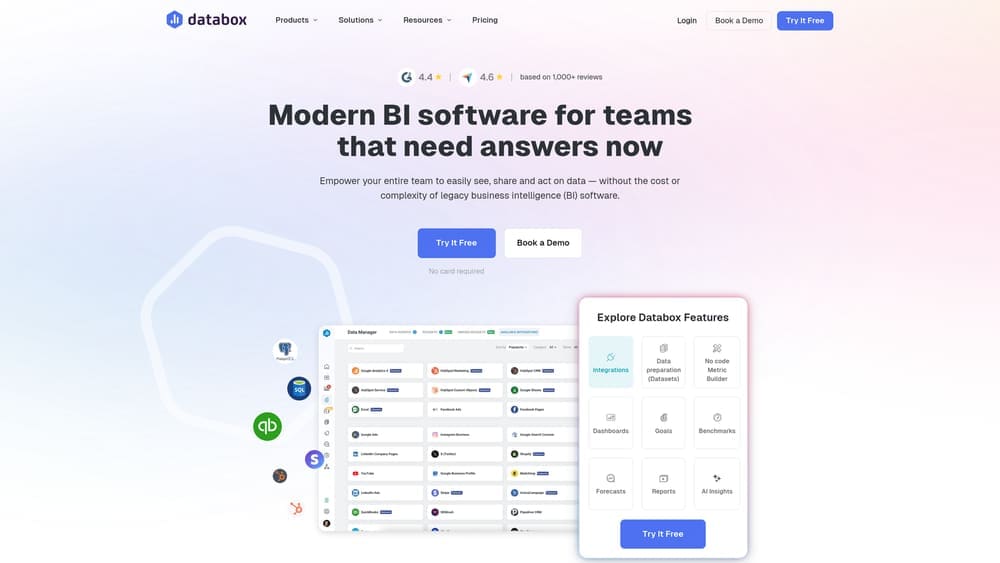
1. Databox
Best for: Small to mid-sized businesses needing quick benchmark comparisons across multiple marketing channels
Databox is a business intelligence platform that connects to 130+ data sources and embeds industry benchmark data directly into your performance dashboards.
Where This Tool Shines
Databox takes a fundamentally different approach to benchmarking—instead of making you visit a separate tool to check industry standards, it displays benchmark context right alongside your metrics in real-time dashboards. When you view your email open rate, you simultaneously see where the 25th, 50th, and 75th percentiles sit for companies like yours. This "always visible" approach means performance gaps become immediately obvious without switching between tools.
The platform's Benchmark Groups feature segments data by industry vertical, company size, and geographic region. You're not comparing your boutique e-commerce brand against enterprise SaaS companies—you're seeing how you stack up against similar businesses. The benchmarks cover email marketing, social media, paid advertising, website analytics, and sales metrics, with data refreshed monthly from thousands of participating companies.
Key Features & Capabilities
Benchmark Groups for 15+ Industries: Join peer groups for SaaS, agencies, e-commerce, professional services, and more to see relevant comparisons.
Percentile Comparison Dashboards: View your metrics against industry 25th, 50th, and 75th percentiles in real-time visual dashboards.
130+ Platform Integrations: Connect Google Analytics, HubSpot, Facebook Ads, Mailchimp, and other tools with one-click setup.
Custom Benchmark Groups: Create private comparison groups with hand-picked competitors or similar companies you want to track.
Mobile Performance Monitoring: Check how you're performing against benchmarks on the go through iOS and Android apps.
Automated Performance Alerts: Receive notifications when your metrics drop below industry standards or competitors make significant moves.
Best For / Ideal Users
Databox works best for marketing teams at companies with $1M-$50M in revenue who need straightforward benchmark comparisons without enterprise complexity. The platform particularly suits agencies managing multiple clients who want to show performance context in reports—you can demonstrate that a client's 18% email open rate isn't just "good" but sits in the top quartile for their industry.
The drag-and-drop dashboard designer makes it accessible for marketers who prefer visual analysis over spreadsheet work. If your team creates weekly or monthly performance reports where benchmark context adds strategic value, Databox integrates that context seamlessly rather than requiring separate research.
Pricing
Databox offers a 14-day free trial of their unlimited plan. The no-code approach and affordable pricing structure make it accessible for growing teams that need business intelligence without the traditional BI platform complexity or cost.
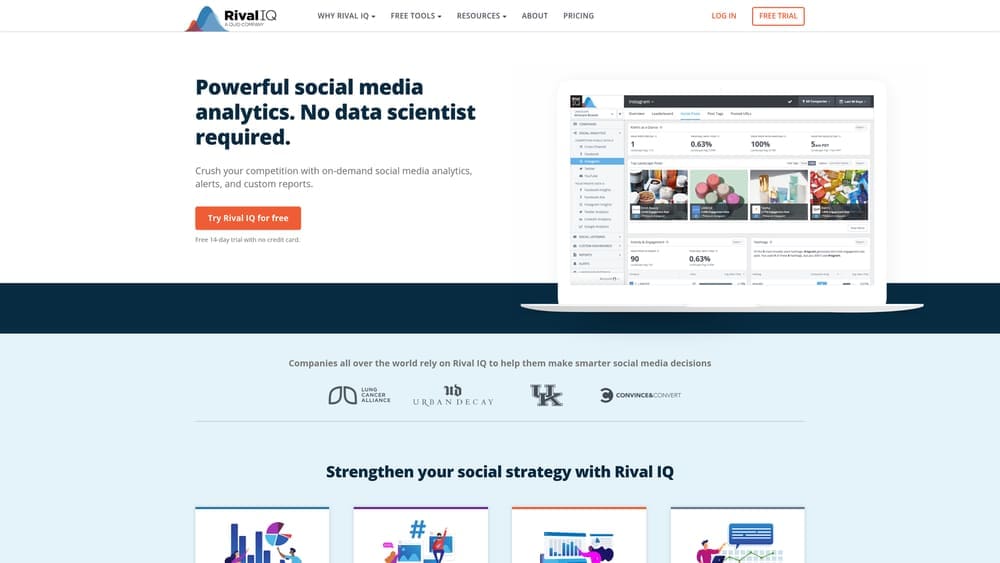
2. Rival IQ
Best for: Social media and content marketers who need deep competitive analysis and industry benchmarks
Rival IQ specializes in social media benchmarking and competitive intelligence across major platforms, providing powerful analytics without requiring a data science background.
Where This Tool Shines
Rival IQ excels at social media performance benchmarking with industry-specific data for engagement rates, posting frequency, content types, and audience growth. The platform analyzes millions of social posts to provide benchmarks segmented by 15+ industries including retail, healthcare, technology, and hospitality.
Unlike generic social analytics tools, Rival IQ shows you not just how your competitors perform but how your entire industry performs—revealing whether low engagement is your problem or an industry-wide trend. The competitive landscape reports are particularly valuable, showing where you rank among direct competitors and industry leaders across Facebook, Instagram, Twitter, LinkedIn, YouTube, and TikTok.
Key Features & Capabilities
Multi-Platform Social Benchmarks: Track performance across all major social networks with weekly updated engagement rate benchmarks specific to your industry vertical.
Competitive Audits: Compare your social presence against 5-250 competitors simultaneously, revealing exactly where you rank in your competitive landscape.
Content Analysis: Discover which post types, topics, and formats drive the highest engagement in your industry, helping you replicate what actually works.
Influencer Identification: Identify the voices and accounts driving conversation in your space, revealing partnership opportunities and competitive threats.
Automated Competitive Alerts: Receive notifications when rivals launch campaigns, experience viral growth, or make significant strategy shifts.
Hashtag Analytics: Track hashtag performance and discover which tags drive engagement in your industry, optimizing your content discoverability.
Best For / Ideal Users
Rival IQ is ideal for social media managers, content marketers, and brand teams who need to justify social strategy decisions with competitive data. It works particularly well for consumer brands in competitive industries where social presence directly impacts sales.
The platform suits teams who create regular competitive intelligence reports for leadership and need to demonstrate how social performance compares to both direct competitors and industry standards. Digital marketers who manage multiple social channels will appreciate the cross-platform benchmarking that reveals which networks deserve more investment.
Pricing
Plans start at $239/month for small teams tracking up to 5 companies. Mid-tier plans run $359-$479/month with more competitor tracking and historical data. Enterprise pricing available for agencies and large brands. Free 14-day trial available.
3. Klipfolio PowerMetrics
Best for: Data-driven teams wanting customizable benchmark dashboards with advanced filtering
Klipfolio PowerMetrics combines business intelligence capabilities with marketing performance benchmarking, giving you control over how you slice and compare industry data.
Where This Tool Shines
PowerMetrics stands out for its flexibility in creating custom benchmark comparisons. While it provides standard industry benchmarks for common marketing metrics, the platform really shines when you need to slice data by multiple dimensions—comparing your performance not just by industry but by company size, growth stage, business model, and geographic market simultaneously.
The platform aggregates benchmark data from its user base while allowing you to import external benchmark reports from sources like Gartner, Forrester, and industry associations. This creates richer context than tools limited to their own data pools. You can build dashboards that answer specific strategic questions rather than settling for pre-configured views.
Key Features & Capabilities
Pre-built benchmark metrics: Ready-to-use comparisons for email, paid search, social media, and website performance across major industries.
Custom metric builder: Create industry-specific KPIs unique to your business when standard metrics don't capture what matters.
Multi-dimensional filtering: Compare against companies matching your exact profile by filtering multiple criteria simultaneously.
Benchmark data import: Upload CSV files and external research reports to supplement the platform's native benchmark data.
Collaboration features: Team discussion tools let you annotate performance gaps and assign action items directly in dashboards.
Goal-setting tools: Automatically adjust targets based on industry performance trends rather than arbitrary internal goals.
Best For / Ideal Users
PowerMetrics works best for analytics teams and marketing operations professionals who want control over how benchmarks are calculated and displayed. It's particularly valuable for companies in niche industries where standard benchmark categories don't quite fit—you can create custom peer groups that actually reflect your competitive landscape.
The platform suits data-literate teams comfortable building custom dashboards and manipulating data views. If your team prefers plug-and-play solutions, this might feel too complex. But if you have analysts who want to answer specific benchmark questions, PowerMetrics provides the flexibility they need.
Pricing
PowerMetrics offers a free plan with basic benchmarking for up to 10 metrics. Professional plans start at $99/month per user with unlimited metrics and advanced benchmark features. Enterprise pricing includes dedicated support and custom data integrations.
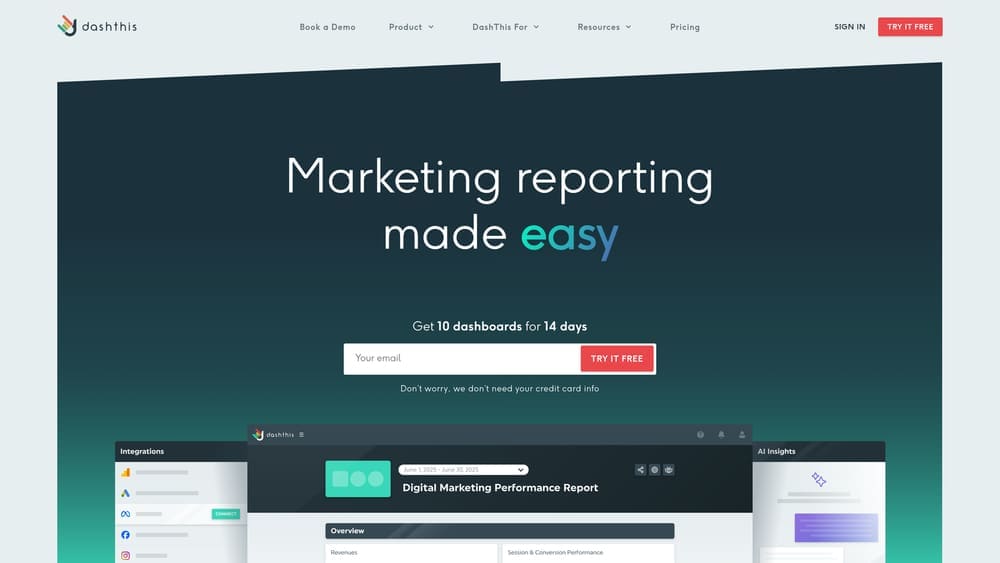
4. DashThis
Best for: Marketing agencies needing white-labeled benchmark reports for multiple clients
DashThis is a reporting platform designed specifically for agencies, with built-in industry benchmarks for client reporting.
Where This Tool Shines
DashThis makes it exceptionally easy for agencies to include industry benchmark context in client reports without manual research. The platform automatically pulls benchmark data for marketing channels and displays it alongside client metrics in clean, white-labeled reports.
What agencies appreciate is the template library—pre-built reports for common client industries like e-commerce, local services, and B2B SaaS that include relevant benchmarks already configured. The platform updates benchmark data monthly and clearly cites data sources, giving agencies credibility when explaining performance gaps to clients. The client portal feature lets clients log in anytime to see how they're tracking against industry standards, reducing "how are we doing?" emails.
Key Features & Capabilities
White-labeled reports: Add your agency branding and customize benchmark comparisons for professional client presentations.
34+ marketing platform integrations: Connects to Google Ads, Facebook, SEMrush, Mailchimp, and other essential marketing tools.
Industry-specific report templates: Pre-configured benchmarks for different verticals save setup time for new clients.
Automated report scheduling: Set reports to generate and send automatically on your preferred schedule.
Client portal access: Clients can view their performance against benchmarks anytime without requesting reports.
Historical benchmark tracking: Shows how industry standards evolve over time, providing valuable context for performance trends.
Best For / Ideal Users
DashThis is purpose-built for digital marketing agencies managing 5-100+ clients who need efficient, professional reporting with benchmark context. It's particularly valuable for agencies whose clients frequently ask "is this good?" about their metrics.
The platform suits agencies prioritizing client communication over deep analytical capabilities. If your agency focuses on clear, visual reporting that helps clients understand their performance in context, DashThis streamlines that workflow considerably.
Pricing
Plans start at $42/month for 3 dashboards. Most agencies use the $134/month plan covering 10 dashboards. Higher-tier plans run $268-$534/month for agencies with larger client rosters. Annual billing provides 20% discounts.
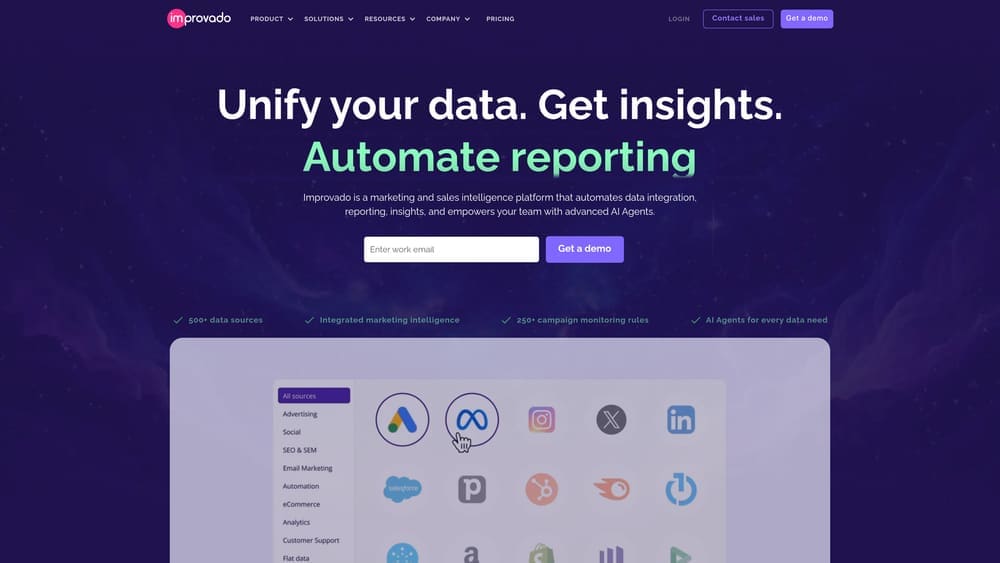
5. Improvado
Best for: Enterprise marketing teams needing comprehensive cross-channel benchmarks with advanced analytics
Improvado is an enterprise marketing analytics platform that aggregates data from 500+ sources and provides sophisticated benchmarking capabilities through AI-powered peer group matching and predictive analytics.
Where This Tool Shines
Improvado handles the complexity that enterprise marketing teams face—dozens of channels, multiple regions, various business units—and provides benchmarks that account for this complexity. The platform doesn't just show you industry averages; it uses machine learning to identify which peer companies are most similar to yours based on dozens of variables, then benchmarks you against that refined peer group.
This produces far more relevant comparisons than broad industry categories. A B2B SaaS company with $200M revenue operating in North America gets compared to similar companies, not lumped in with $10M startups or $2B enterprises. Improvado also excels at cross-channel benchmarking, showing how top performers allocate budget across channels and how that differs by industry. The platform's data warehouse approach means you can run custom benchmark queries that answer specific strategic questions.
Key Features & Capabilities
AI-Powered Peer Group Identification: Machine learning analyzes company characteristics to create relevant benchmark comparisons beyond simple industry categories.
Cross-Channel Budget Allocation Benchmarks: Shows how top performers distribute spend across channels, revealing strategic patterns by industry and company size.
500+ Marketing Platform Integrations: Automated data normalization ensures consistent metrics across all your marketing tools and platforms.
Custom Benchmark Queries: SQL access lets analytics teams run specific benchmark queries answering strategic questions unique to your business.
Multi-Touch Attribution Benchmarks: Industry-specific data showing how different sectors credit conversions across touchpoints.
Predictive Benchmarking: Forecasts where industry standards are heading based on current trends and top performer behavior.
Best For / Ideal Users
Improvado serves enterprise marketing teams at companies with $100M+ revenue running complex, multi-channel campaigns across regions. It's ideal for marketing operations leaders who need to justify budget allocation decisions to CFOs with competitive data.
The platform suits organizations with dedicated marketing analytics teams who can leverage the advanced query capabilities and custom analysis features. Companies making million-dollar budget decisions benefit most from the precision of AI-powered peer matching.
Pricing
Improvado uses custom enterprise pricing based on data volume, number of integrations, and user count. Typical implementations start at $2,000-$3,000/month with setup fees. Annual contracts required.
6. Supermetrics
Best for: Performance marketers who need benchmark data integrated directly into their existing BI tools
Supermetrics is a marketing intelligence platform that moves data from 150+ marketing sources into the analytics tools you already use—Google Sheets, Excel, Looker Studio, Tableau, Power BI, and more.
Where This Tool Shines
Supermetrics takes a fundamentally different approach to benchmarking than standalone dashboard tools. Instead of forcing you to learn yet another platform, it pipes benchmark data directly into whatever analytics environment your team already lives in. This means your data analysts can build sophisticated benchmark comparisons using the formulas, visualizations, and workflows they're already comfortable with.
The real power emerges when you combine your performance data with industry benchmarks in custom ways. Want to see how your Facebook ad CTR compares to industry standards, segmented by campaign objective and audience size? Build it in Tableau. Need a Google Sheet that automatically flags when any metric drops below the 25th percentile for your industry? Set it up once and it updates daily. This flexibility matters most for teams with strong analytics capabilities who find pre-built dashboards limiting.
Key Features & Capabilities
Data Pipeline Architecture: Automated connectors move data from marketing platforms into your chosen destination on schedules you control.
Benchmark Data Feeds: Industry performance data for paid advertising, SEO metrics, and social media available as additional data sources.
Multi-Platform Support: Works with Google Sheets, Excel, Looker Studio, Tableau, Power BI, Snowflake, BigQuery, and other BI tools.
Historical Depth: Access to 24+ months of historical benchmark data for trend analysis and year-over-year comparisons.
Industry Segmentation: Benchmark data filtered by vertical, company size, and geographic region for relevant comparisons.
API Access: Developers can build custom applications pulling benchmark data programmatically for specialized use cases.
Best For / Ideal Users
Supermetrics fits teams that already have established analytics workflows in tools like Tableau or Looker Studio and want to enhance them with benchmark context rather than adopting a new platform. It's particularly valuable for companies with dedicated data analysts or marketing operations professionals who prefer building custom solutions.
The platform works well for performance marketing teams running complex campaigns across multiple channels who need to combine granular campaign data with industry benchmarks in sophisticated ways. If your team thinks in terms of data pipelines, refresh schedules, and custom calculations, Supermetrics speaks your language.
Pricing
Supermetrics pricing varies by destination platform and data volume. Google Sheets connectors start at $19/month for basic use. BI platform connectors for Tableau, Power BI, or Looker Studio typically run $99-$199/month per user. Benchmark data access adds $50-$100/month to base connector pricing depending on the scope of industries and metrics needed.
7. AgencyAnalytics
Best for: Marketing agencies needing all-in-one client reporting with built-in industry benchmarks
AgencyAnalytics combines client reporting, rank tracking, and call tracking with comprehensive marketing benchmarks specifically designed for agencies managing local and small business clients.
Where This Tool Shines
AgencyAnalytics focuses on the metrics that matter most to local businesses—areas where enterprise-focused tools often fall short. The platform provides industry-specific benchmarks for local SEO, Google Business Profile performance, local paid search, and reputation management. These aren't generic national averages but benchmarks segmented by city and industry vertical, so a restaurant in Austin can see how their local pack rankings compare to other restaurants in their market.
The rank tracking feature includes local pack benchmarks that show clients exactly where they stand in map results versus competitors. For agencies, this eliminates the constant "is this good?" questions from clients. The white-label client portal with embedded benchmarks makes performance context self-service—clients can log in anytime to see their standing without requiring agency interpretation.
Key Features & Capabilities
Local SEO Benchmarks: Google Business Profile metrics, local pack rankings, and citation consistency compared to industry standards in specific geographic markets.
Industry-Specific Verticals: Pre-built benchmarks for 20+ industries including restaurants, legal services, healthcare providers, home services, real estate, and automotive.
Automated Client Reporting: Benchmark comparisons included by default in client reports, with customizable templates that show performance context without manual research.
Rank Tracking with Context: Local search visibility benchmarks segmented by city and industry, showing where clients rank in their specific competitive landscape.
Call Tracking Integration: Inbound lead benchmarks for local businesses, comparing call volume and conversion rates against similar companies in the same market.
Client Portal Access: Interactive benchmark dashboards that clients can access independently, reducing agency time spent answering basic performance questions.
Best For / Ideal Users
AgencyAnalytics is purpose-built for agencies serving local businesses and small companies with 1-50 employees. The platform excels for agencies specializing in local SEO, reputation management, and local paid advertising where geographic context matters significantly.
It's particularly valuable for agencies whose clients operate in competitive local markets—multiple dentists in the same city, competing restaurants, local law firms—where showing relative performance is crucial for retention. The platform suits agencies prioritizing ease of use and clear client communication over advanced analytical capabilities.
Pricing
Plans start at $12 per month per client campaign with a 5-campaign minimum ($60/month total). Most agencies use the $18 per month per campaign tier which includes advanced features and more comprehensive benchmark access. Volume discounts are available for agencies managing 50+ clients, and all plans include benchmark data access without additional fees.
Putting It All Together
The right benchmarking tool isn't about features—it's about matching capabilities to how you actually work. Databox and Klipfolio PowerMetrics excel when you need benchmarks embedded in existing workflows, visible every time you check performance. Rival IQ stands alone for social media depth, while DashThis and AgencyAnalytics solve the specific challenge agencies face: showing clients competitive context without manual research.
For teams already invested in BI platforms like Tableau or Looker Studio, Supermetrics pipes benchmark data directly into your existing reports. Enterprise marketers making complex budget allocation decisions across regions and channels need Improvado's AI-powered peer matching and cross-channel insights.
The selection comes down to three questions: What's your budget reality? Which channels drive your business? How will your team actually use this data? A $50/month tool you check weekly beats a $3,000/month platform that sits unused.
Here's what separates teams that get value from benchmarking tools versus those who don't: they build benchmark reviews into regular reporting cadence. When metrics fall below industry standards, they investigate what top performers do differently. When they exceed benchmarks, they document the approach to replicate it elsewhere.
Stop guessing whether your marketing performance is competitive. Pick the tool that fits your workflow, set up your industry comparisons, and start making decisions backed by real market data. Need help optimizing your marketing strategy with data-driven insights? Learn more about our services.
Campaign
Creatives
quick links
contact
© 2025 Campaign Creatives.
All rights reserved.