campaign
creatives

7 Best Marketing Analytics Dashboard Setup Tools To Maximize ROI
This comprehensive guide evaluates seven marketing analytics dashboard setup platforms based on setup complexity, data accuracy, and speed to actionable insights, helping you choose the right tool for your team's technical capabilities and budget.
You're drowning in data from Google Analytics, Facebook Ads Manager, email platforms, and CRM systems—but you still can't answer your CEO's simple question: "Which campaigns are actually making us money?"
Sound familiar? Most marketing teams waste 8-12 hours weekly toggling between platforms, copying data into spreadsheets, and building reports that are outdated the moment they're finished. Meanwhile, critical insights about customer behavior, attribution, and campaign performance remain buried across disconnected tools.
The solution isn't working harder—it's working smarter with a unified marketing analytics dashboard. But here's the challenge: not all dashboards are created equal. Some require data engineering teams to set up. Others look impressive in demos but crumble under real-world complexity.
We've spent the past six months testing every major marketing analytics platform, evaluating setup complexity, data accuracy, visualization capabilities, and—most importantly—how quickly each tool delivers actionable insights. This guide cuts through the marketing fluff to show you exactly what each platform does well, where it falls short, and which one matches your team's technical capabilities and budget.
Whether you're a solo marketer managing multiple clients or leading a team at a growth-stage company, you'll find a dashboard here that transforms your scattered data into clear, actionable intelligence.
1. Google Looker Studio
Best for: Budget-conscious teams already using Google Marketing Platform tools
Google Looker Studio remains the go-to choice for marketers who need professional dashboards without the professional price tag.

Where This Tool Shines
Looker Studio excels at democratizing data visualization for teams already invested in Google's ecosystem. You can build a functional marketing dashboard in under an hour using pre-built templates, then customize everything from color schemes to calculated fields without touching code.
The platform's real strength emerges when connecting multiple Google data sources. Combining GA4 traffic data alongside Google Ads spend and Search Console rankings creates a comprehensive view of organic and paid performance in one place. The sharing capabilities mirror Google Drive's simplicity—anyone with the link can view reports, while you control editing permissions through familiar Google account management.
Key Features & Capabilities
Native Google Integrations: Direct connections to Google Analytics 4, Google Ads, Search Console, YouTube Analytics, and Google Sheets with real-time data refresh.
Drag-and-Drop Builder: Customizable charts, tables, scorecards, and date range controls that non-technical marketers can configure without training.
Calculated Fields: Create custom metrics like cost-per-acquisition or ROAS using familiar spreadsheet-style formulas.
Data Blending: Combine metrics from multiple sources into unified visualizations for cross-platform analysis.
Community Templates: Access hundreds of pre-built dashboard templates for SEO, PPC, social media, and web analytics use cases.
Setup Considerations
The platform works best when your marketing stack centers on Google tools. Teams heavily reliant on HubSpot, Salesforce, or Adobe platforms will need third-party connectors (like Supermetrics) that introduce additional costs and potential data refresh delays.
Understanding the difference between data blending and joining matters for accuracy. Blending works well for combining metrics at the same date level, but complex multi-source analysis may require preprocessing data in Google Sheets first.
Best For / Ideal Users
Small to mid-sized marketing teams, agencies managing multiple clients, and solo marketers who need professional reporting without budget constraints. Particularly valuable if Google Analytics 4 and Google Ads serve as your primary platforms.
For agencies, the ability to duplicate dashboards and swap data sources saves hours of repetitive work when onboarding new clients with similar reporting needs.
Pricing
Completely free for unlimited reports and viewers. Google offers Looker Studio Pro starting around $9 per user/month with enhanced collaboration features.
2. Tableau
Best for: Enterprise teams requiring advanced analytics and complex data modeling
Tableau has earned its reputation as the gold standard for business intelligence and data visualization.
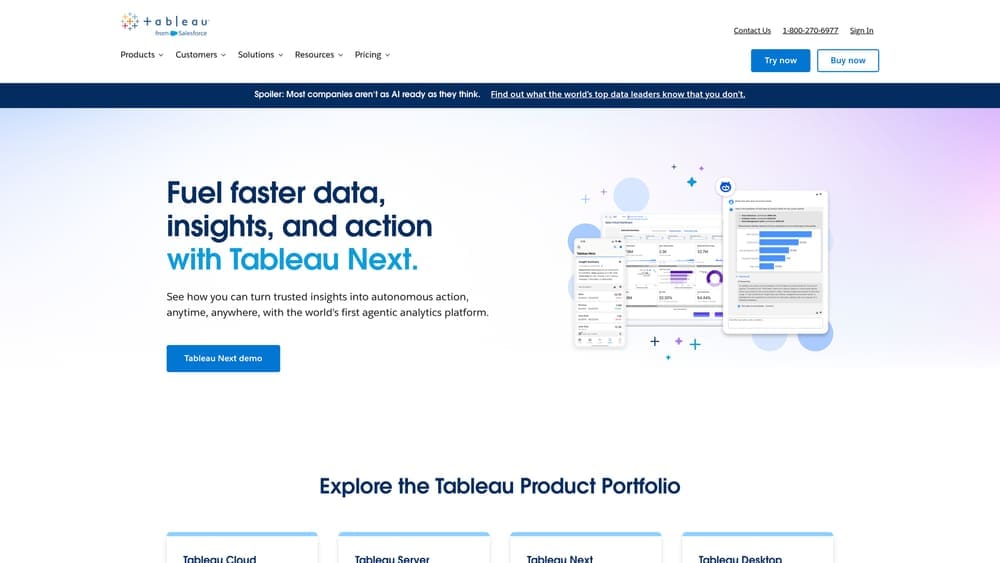
Where This Tool Shines
Tableau's true power emerges when handling complex, multi-source data analysis. You can blend customer journey data from your CRM with advertising spend from multiple platforms, website behavior from analytics tools, and revenue data from your ERP system—all within a single dashboard.
The platform's calculation engine handles sophisticated metrics like customer lifetime value, multi-touch attribution modeling, and cohort analysis that would require custom coding in other tools. Tableau's visualization library goes far beyond basic charts, offering heat maps, funnel diagrams, geographic mapping, and interactive filters that let executives explore data themselves rather than requesting new reports.
Key Features & Capabilities
100+ Native Data Connectors: Direct integration with Salesforce, Adobe Analytics, HubSpot, and major advertising platforms eliminates manual data exports.
Advanced Calculated Fields: Statistical functions, table calculations, and level-of-detail expressions enable sophisticated metric creation without coding.
Interactive Dashboards: Drill-down capabilities, dynamic filters, and parameter controls let users explore data paths relevant to their questions.
Tableau Prep Integration: Built-in data cleaning and transformation tools prepare messy marketing data before visualization.
Mobile-Optimized Views: Dashboards maintain full functionality on tablets and phones, not just scaled-down desktop versions.
Enterprise Deployment Options: Tableau Server for self-hosted control or Tableau Cloud for managed SaaS deployment with centralized governance.
AI-Powered Insights: "Ask Data" feature lets non-technical users query dashboards using natural language questions.
Best For / Ideal Users
Enterprise marketing teams with dedicated analytics resources, organizations requiring sophisticated attribution modeling, and companies where marketing dashboards serve multiple departments beyond marketing.
Best suited for teams comfortable with data concepts and willing to invest in training. The learning curve is real—expect 2-3 months before users become proficient with advanced features.
Not recommended for small teams seeking quick setup or marketers without analytical support. If you need dashboards running this week rather than this quarter, simpler alternatives make more sense.
Pricing
Tableau Creator licenses start at $75 per user/month (billed annually), which includes desktop authoring capabilities.
3. Supermetrics
Best for: Marketers who need automated data pipelines without technical complexity
Supermetrics solves a problem that plagues marketing teams: getting clean, reliable data from advertising platforms into your preferred visualization tool.
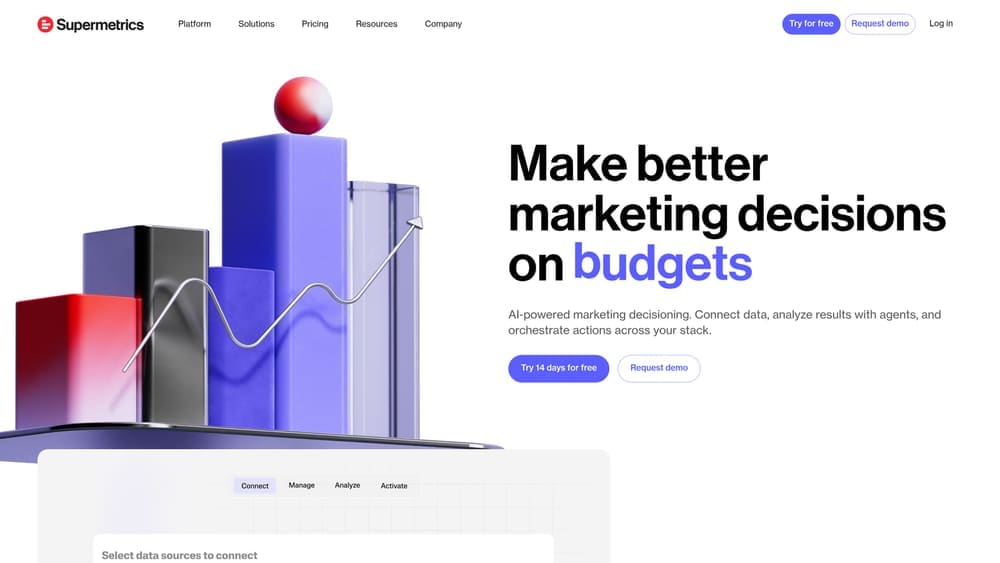
Where This Tool Shines
Supermetrics eliminates the manual export-import cycle that wastes hours each week. Set up your data connections once, and the platform refreshes your dashboards automatically—daily, hourly, or in real-time depending on your plan.
The platform excels at normalizing data across platforms. Facebook's "Link Clicks" becomes comparable to Google's "Clicks" through consistent field mapping, making cross-platform analysis actually meaningful. For agencies managing dozens of client accounts, Supermetrics' template system lets you build one dashboard structure and replicate it across all clients with different data sources.
The Google Sheets integration particularly shines. You can combine automated data pulls with custom calculations, pivot tables, and familiar spreadsheet functionality before visualizing in Looker Studio. This workflow gives you the flexibility of spreadsheets with the reliability of automated data pipelines.
Key Features & Capabilities
Extensive Platform Coverage: Connects to over 150 marketing platforms including all major ad networks, analytics tools, and social media channels.
Flexible Scheduling: Configure automatic data refreshes from hourly to monthly intervals based on your reporting needs.
Historical Data Backfill: Retrieve historical campaign data beyond what platforms typically retain, enabling long-term trend analysis.
Multi-Account Management: Handle numerous client profiles efficiently with centralized authentication and data source management.
Multiple Destinations: Send data to Google Sheets, Looker Studio, Excel, BigQuery, Snowflake, or access directly via API.
Template Marketplace: Access pre-configured dashboard setups for common marketing use cases to accelerate implementation.
Best For / Ideal Users
Marketing agencies managing multiple client accounts who need consistent reporting structures across different businesses. In-house teams running campaigns across five or more platforms who spend excessive time on manual data compilation.
Particularly valuable for marketers who prefer building dashboards in familiar tools like Google Sheets or Looker Studio rather than learning specialized BI software. Teams without data engineering resources who need reliable automated reporting will find Supermetrics removes technical barriers to sophisticated analytics.
Pricing
Plans start at $99/month for the Essential tier, which limits you to Google Sheets and Looker Studio destinations with two data sources. The Core plan at $399/month includes unlimited data sources and adds Excel and BigQuery destinations.
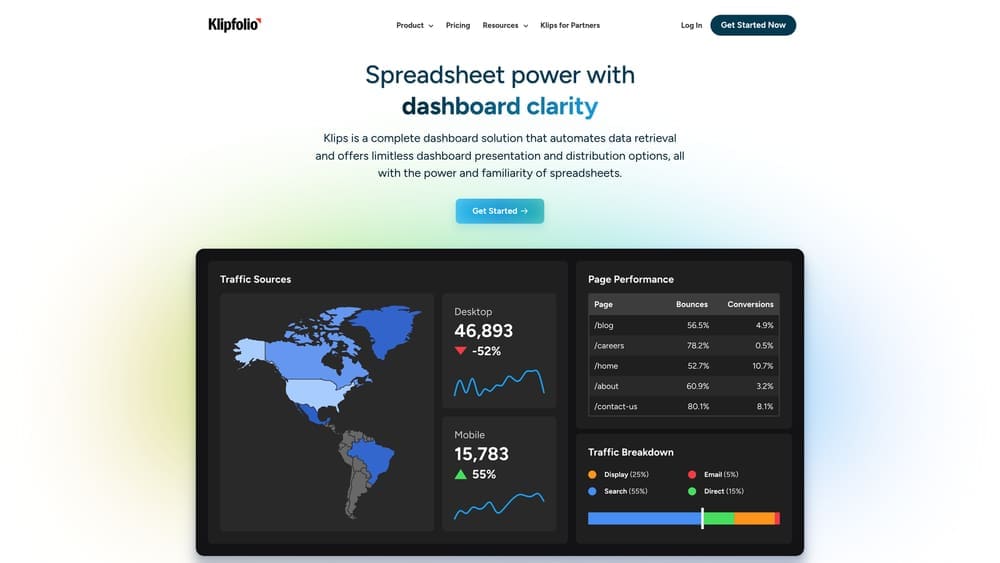
4. Klipfolio PowerMetrics
Best for: Teams wanting pre-built marketing metrics without custom dashboard building
Klipfolio PowerMetrics flips the traditional dashboard approach on its head—instead of handing you blank canvases and expecting you to figure out what to track, it provides a curated library of pre-configured marketing metrics that you can activate with a few clicks.
Where This Tool Shines
PowerMetrics eliminates the "what should I measure?" paralysis that stalls many dashboard projects. Connect your Google Analytics, Facebook Ads, or HubSpot account, and the platform automatically suggests relevant metrics based on your role—whether you're managing SEO, running paid campaigns, or overseeing email marketing. Each metric comes pre-built with industry-standard calculations, so you're not wrestling with formulas to figure out how to calculate customer acquisition cost or marketing-qualified leads.
The anomaly detection feature runs quietly in the background, analyzing your metrics for unusual patterns. When your cost-per-click suddenly spikes 40% above normal, you get a Slack notification before you've even opened your laptop. This proactive alerting transforms dashboards from something you check into something that actively monitors your marketing performance.
Key Features & Capabilities
Pre-Built Metric Libraries: Hundreds of ready-to-use KPIs organized by marketing discipline—SEO rankings and organic traffic, PPC cost metrics and ROAS, social engagement rates, email open and click-through rates, and web analytics conversions.
Intelligent Alerts: Automatic trend detection that notifies you via Slack, email, or mobile push when metrics deviate from expected patterns, with customizable sensitivity levels to reduce noise.
Goal Tracking System: Set targets for any metric with visual progress indicators, deadline tracking, and automatic notifications when goals are achieved or at risk.
Collaborative Features: Team members can comment directly on specific metrics, use @mentions to loop in colleagues, and maintain conversation threads tied to performance data.
Role-Based Views: Each team member sees only their relevant metrics—your PPC specialist sees ad performance while your content manager tracks SEO metrics, all without cluttering everyone's dashboard with irrelevant data.
Best For / Ideal Users
Marketing managers who need visibility into team performance without becoming dashboard designers, growing companies establishing their first structured analytics practice, and teams where multiple people track different KPIs but don't want to build separate dashboards. PowerMetrics works particularly well for organizations that value speed over customization—you'll have meaningful metrics tracking within an hour rather than spending days designing custom visualizations.
Less suitable for teams requiring highly customized visualizations or complex data transformations.
5. Databox
Best for: Agencies and teams needing client-friendly dashboards with mobile access
Databox transforms scattered marketing metrics into polished, stakeholder-ready dashboards that look as good on your phone as they do in the boardroom.
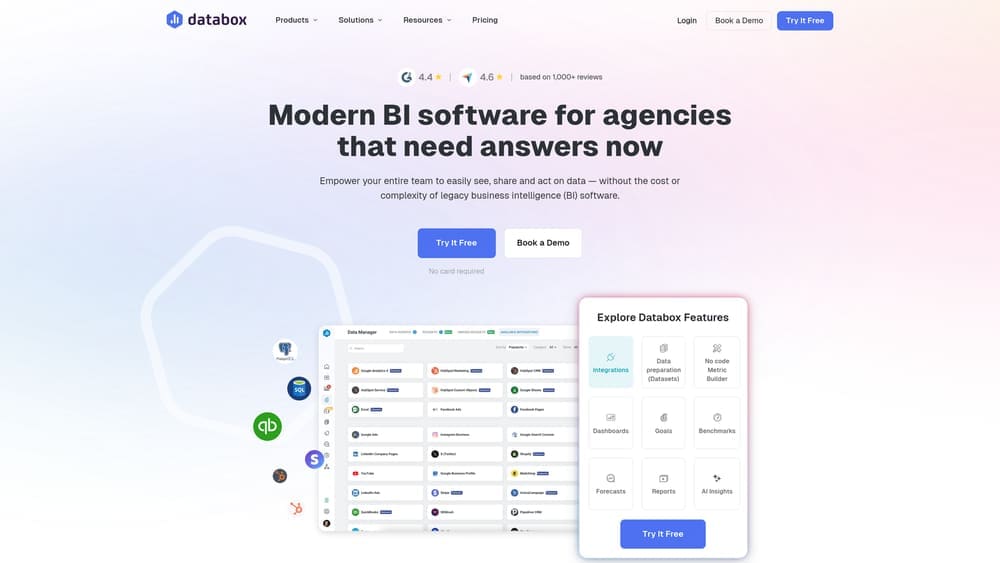
Where This Tool Shines
Databox solves the presentation problem that technical analytics platforms create. While tools like Tableau excel at deep analysis, they often produce dashboards that confuse non-technical stakeholders. Databox takes the opposite approach—every element is designed for clarity and visual appeal.
The platform's block-based dashboard designer eliminates the learning curve. You select pre-configured metric visualizations called "Datablocks"—each optimized for specific KPIs like conversion rate, revenue, or traffic sources—and arrange them visually. No SQL queries, no complex formulas, just drag-and-drop simplicity that still produces professional results.
What truly differentiates Databox is its mobile-first philosophy. The iOS and Android apps aren't stripped-down versions of the desktop experience—they're fully functional interfaces where you can view dashboards, receive push notifications when metrics hit thresholds, and even build simple reports from your phone during your commute. For marketing directors constantly in meetings or traveling between client sites, this accessibility changes how you stay connected to performance.
The client portal functionality makes Databox invaluable for agencies. Give clients view-only access to their specific dashboards without exposing other accounts or forcing them to learn new software. Add your agency's branding, and these dashboards become professional deliverables that strengthen client relationships. The "Databoards" feature takes this further—create TV-ready displays for office monitors that keep entire teams aligned on current performance without anyone needing to log in.
Key Features & Capabilities
100+ Pre-Built Integrations: Native connections to Google Analytics, Facebook Ads, HubSpot, Salesforce, Shopify, and other major marketing platforms with automatic data syncing.
Drag-and-Drop Dashboard Designer: Choose from 200+ pre-configured metric visualizations optimized for specific KPIs, arrange them visually without coding.
Full-Featured Mobile Apps: iOS and Android apps with complete dashboard access, push notifications for goal alerts, and mobile report building capabilities.
Goal Tracking System: Set performance targets for any metric and receive automatic alerts when you exceed thresholds or fall behind pace.
Agency Client Portal: White-label dashboard sharing with custom branding, view-only access controls, and multi-client management from single interface.
Automated Report Delivery: Schedule dashboard snapshots via email or Slack channels, ensuring stakeholders stay informed.
6. Improvado
Best for: Enterprise marketing teams managing complex multi-channel attribution
Improvado operates at a different scale than most marketing analytics tools—it's not a dashboard builder but a complete marketing data pipeline that extracts, transforms, and loads data from 500+ sources into your existing analytics infrastructure.
Where This Tool Shines
Improvado solves the data engineering nightmare that keeps enterprise marketing ops teams up at night. When you're running campaigns across Salesforce, Adobe Marketing Cloud, Google Ads, Facebook, LinkedIn, TikTok, and a dozen other platforms—plus custom internal systems—you need more than a pretty dashboard. You need bulletproof data pipelines that don't break when platforms change their APIs or rate limits.
The platform's transformation layer is where the real magic happens. It automatically normalizes metrics across platforms—mapping Google Ads "Clicks" to Facebook's "Link Clicks" to LinkedIn's "Clicks"—so you're comparing apples to apples. For global campaigns, it handles currency conversions automatically. Running campaigns in 15 countries? Improvado converts everything to your reporting currency before it hits your warehouse. The platform also tackles historical data backfills, often retrieving years of campaign data that platforms no longer expose through standard APIs.
Key Features & Capabilities
500+ Pre-Built Connectors: Coverage spans advertising platforms, analytics tools, CRMs, email systems, social media, and e-commerce platforms with authentication and rate limiting handled automatically.
Automated Data Extraction: Configurable refresh schedules from hourly to daily, with historical backfills that retrieve data beyond platform retention limits.
Transformation Engine: Normalizes metrics across platforms, handles currency conversions for global campaigns, and applies custom business logic before warehouse loading.
Flexible Data Destinations: Direct loading into data warehouses like Snowflake, BigQuery, and Redshift, or BI tools including Tableau, Looker, and Power BI.
Data Quality Monitoring: Anomaly detection and automated alerts for missing data, unusual spikes, or integration failures before they corrupt your dashboards.
Marketing Data Model: Pre-configured schemas for common use cases eliminate the need to design data structures from scratch.
Dedicated Customer Success: Implementation support and ongoing optimization from a team that understands enterprise marketing complexity.
Best For / Ideal Users
Enterprise marketing teams at companies with $50M+ annual revenue running sophisticated campaigns across 20+ channels. Organizations with existing data warehouses seeking to centralize marketing data without building custom integrations. Companies with dedicated marketing operations or analytics roles who can leverage the platform's advanced capabilities.
7. HubSpot Marketing Analytics
Best for: HubSpot users wanting unified inbound marketing and sales visibility
HubSpot Marketing Analytics transforms the platform's CRM foundation into a comprehensive analytics engine that connects every touchpoint in your customer journey—from anonymous website visitor to closed deal.

Where This Tool Shines
HubSpot's analytics suite eliminates the integration headaches that plague multi-tool marketing stacks. Because your website tracking, email campaigns, social posts, landing pages, and CRM data all live within HubSpot's ecosystem, attribution happens automatically. When a contact converts, you see their complete journey—which blog posts they read, which emails they opened, which ads they clicked—without configuring complex tracking parameters or worrying about cookie deprecation breaking your attribution model.
The platform's attribution reporting stands out for its accessibility. You can switch between first-touch, last-touch, and multi-touch attribution models with a single click, comparing how different models change your understanding of campaign performance. For marketing teams reporting to sales leadership, the closed-loop reporting connects marketing activities directly to revenue, showing exactly which campaigns influenced deals that actually closed.
Key Features & Capabilities
Unified Contact Timeline: Every interaction—website visits, email opens, form submissions, social engagement—appears in a single chronological view per contact.
Campaign Attribution Reports: Track revenue influence across multiple attribution models without external tools or complex setup.
Traffic Analytics: Built-in website analytics comparable to Google Analytics but with automatic connection to contact records and deal data.
Custom Report Builder: Drag-and-drop interface for creating reports combining marketing, sales, and service data with custom filters and breakdowns.
Marketing Dashboard Library: Pre-built dashboards for email performance, social media ROI, landing page conversion, and campaign effectiveness.
Revenue Attribution: Automatic calculation of marketing-influenced revenue and deal velocity metrics tied to specific campaigns or assets.
Best For / Ideal Users
B2B marketing teams already using HubSpot for email marketing, landing pages, or CRM who need visibility into how marketing activities influence pipeline and revenue. Particularly valuable for organizations where marketing and sales teams need shared visibility into lead quality and campaign performance. The platform works best for inbound-focused strategies where content, email, and organic channels drive most leads.
Less suitable for teams heavily reliant on paid advertising across multiple platforms (Facebook, Google, LinkedIn) or organizations needing advanced data science capabilities like predictive modeling or complex statistical analysis.
Pricing
Analytics capabilities scale with HubSpot subscription tiers. Marketing Hub Professional starts at $800/month and includes advanced reporting features.
Making the Right Choice
The right marketing analytics dashboard isn't about features—it's about matching your team's technical capabilities with your reporting needs.
If you're working within Google's ecosystem and need quick setup without budget constraints, Google Looker Studio delivers professional dashboards in hours. For agencies juggling multiple clients who demand polished, mobile-accessible reports, Databox eliminates the presentation headaches. Enterprise teams wrestling with complex attribution across dozens of channels will find Improvado's data pipeline approach worth the investment.
The common thread among successful implementations? Teams that prioritize time-to-insight over feature lists. A simpler dashboard that your team actually uses daily beats a sophisticated platform that requires a data engineer to maintain.
Start with your current pain point: Is it manual data collection? Choose Supermetrics. Scattered metrics across tools? Try Klipfolio PowerMetrics. Complex enterprise attribution? Evaluate Improvado. Already using HubSpot? Leverage its built-in analytics before adding another tool.
Most platforms offer free trials—take advantage of them. Build one dashboard with real data before committing. The best choice becomes obvious when you see how quickly you can answer that CEO question about campaign ROI.
Need help implementing a marketing analytics strategy that actually drives decisions? Learn more about our services and how we help businesses transform scattered data into competitive advantages.
Campaign
Creatives
quick links
contact
© 2025 Campaign Creatives.
All rights reserved.