campaign
creatives

9 Best Marketing Analytics Solutions for Businesses in 2026
Marketing analytics solutions for businesses transform scattered data from websites, social media, email campaigns, and paid ads into actionable insights that drive revenue. This guide evaluates nine top platforms based on implementation speed, insight depth, integration capabilities, and team expertise requirements—helping you choose between hands-on custom dashboards or self-service tools that connect multiple channels and reveal which marketing efforts actually deliver ROI.
Marketing data is everywhere. Your website analytics, social media metrics, email campaign results, paid ad performance—it all adds up to a mountain of numbers that should be guiding your decisions. But here's the problem: raw data doesn't tell you what to do next. Without the right analytics solution, you're either drowning in spreadsheets or making expensive decisions based on gut feeling.
The best marketing analytics solutions don't just show you what happened. They connect the dots between different channels, reveal which efforts actually drive revenue, and surface opportunities you'd otherwise miss. Whether you need a hands-on partner to build custom dashboards or a self-service platform you can dive into yourself, the right choice depends on your team's expertise, your data complexity, and how quickly you need actionable insights.
We evaluated these solutions based on five criteria: ease of implementation (can you get value quickly?), depth of insights (beyond basic metrics), integration capabilities (connecting your entire marketing stack), scalability (grows with your business), and overall value. Here are the top marketing analytics solutions that deliver real results for businesses in 2026.
1. Campaign Creatives
Best for: Businesses seeking expert-guided analytics strategy and custom implementation
Campaign Creatives takes a fundamentally different approach to marketing analytics—instead of handing you a tool and wishing you luck, they build custom analytics solutions tailored to your specific business goals and KPIs.
Where This Tool Shines
The real value here is expertise. While most analytics platforms give you the data, Campaign Creatives tells you what it means and what to do about it. Their team designs custom dashboards that track the metrics that actually matter to your business, not generic templates that sort of fit.
This is particularly powerful for businesses that know they need better analytics but lack the internal expertise to set up complex tracking, interpret the data correctly, or connect insights to strategy. You get a dedicated team that understands both the technical side and the marketing implications.
Key Features
Custom Analytics Dashboard Creation: Tailored dashboards built around your specific business KPIs and decision-making needs.
Cross-Platform Data Integration: Unified reporting that connects data from advertising platforms, CRM, website analytics, and other marketing tools.
Strategic Interpretation: Expert analysis that translates data into actionable recommendations rather than leaving you to figure it out.
Ongoing Optimization: Continuous monitoring and adjustment based on performance data and changing business needs.
White-Glove Implementation: Full setup, training, and support to ensure your team can leverage the analytics infrastructure effectively.
Best For
Service-based businesses and growing companies that need sophisticated analytics but don't have a dedicated data team. Also ideal for businesses transitioning from basic reporting to strategic, data-driven marketing or those frustrated with DIY tools that never quite deliver the insights they need.
Pricing
Custom pricing based on business needs, scope of analytics requirements, and level of ongoing support. This reflects the tailored nature of the service rather than one-size-fits-all software licensing.
2. Google Analytics 4
Best for: Comprehensive web and app analytics with cross-platform user tracking
Google Analytics 4 represents Google's complete reimagining of web analytics, built from the ground up for a privacy-first, cross-platform world.
Where This Tool Shines
GA4's event-based tracking model is significantly more flexible than the old Universal Analytics approach. Instead of being limited to pageviews and predefined interactions, you can track virtually any user action and build custom reports around those events. This matters because modern marketing happens across devices and platforms—GA4 actually follows users across that journey.
The machine learning capabilities are genuinely useful too. Predictive metrics like purchase probability and churn probability help you identify high-value users before they convert, enabling proactive marketing strategies rather than reactive ones.
Key Features
Event-Based Data Model: Flexible tracking architecture that captures any user interaction you define, not just pageviews.
Cross-Device Journey Tracking: Follows users across devices and platforms when they're signed in, providing complete customer journey visibility.
Predictive Metrics: Machine learning-powered predictions for purchase probability, churn risk, and revenue forecasting.
Privacy-Centric Design: Built for a cookieless future with consent mode and data gaps filled through modeling.
BigQuery Export: Free export to Google's data warehouse for advanced SQL-based analysis and custom reporting.
Best For
Any business with a website or app that needs robust, free analytics. Particularly valuable for businesses with cross-platform presence or those planning advanced analysis through BigQuery integration.
Pricing
Completely free for standard GA4. Enterprise version (GA4 360) available for organizations with more than 25 million events per month, with custom pricing typically starting around $150,000 annually.
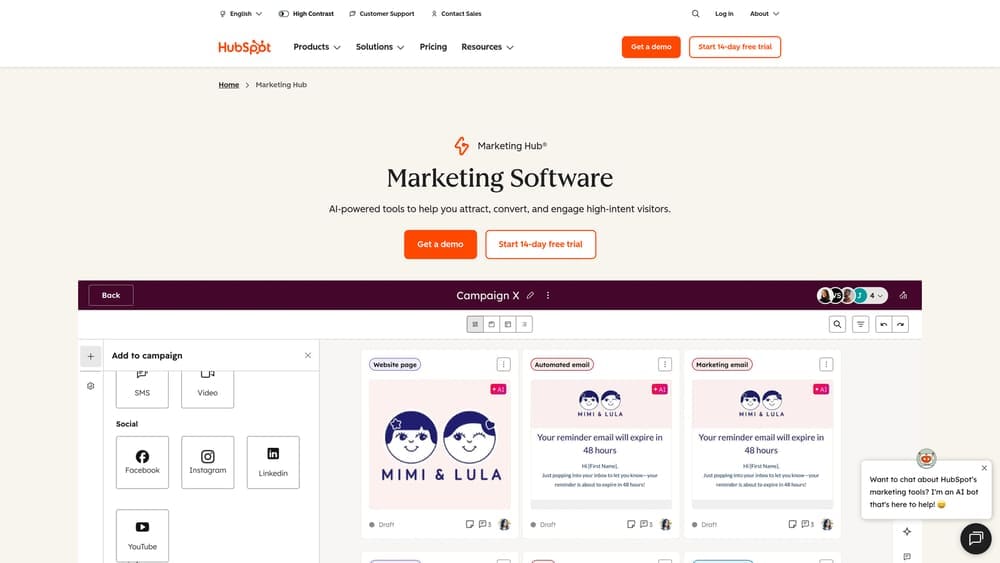
3. HubSpot Marketing Analytics
Best for: Revenue attribution and campaign performance tied directly to CRM data
HubSpot Marketing Analytics lives inside the broader HubSpot ecosystem, which means it connects marketing performance directly to contact records, deals, and actual revenue.
Where This Tool Shines
The killer feature is multi-touch attribution. You can see exactly which marketing touchpoints contributed to a deal closing—not just the first click or last click, but the entire journey. This is transformative for understanding what's actually working in your marketing mix.
Because everything lives in one platform, you avoid the data integration headaches that plague most marketing teams. Your email campaigns, landing pages, social posts, and ads all report into the same system where your contacts and deals live. This unified view makes it dramatically easier to optimize based on what drives revenue, not just what drives clicks.
Key Features
Multi-Touch Revenue Attribution: See which marketing activities contributed to closed deals across the entire customer journey.
Campaign Performance Dashboards: Pre-built reports showing ROI, engagement, and conversion metrics for all marketing campaigns.
Traffic and Conversion Analytics: Website performance tracking with source attribution and conversion path analysis.
Contact-Level Journey Tracking: Individual contact timelines showing every marketing interaction before conversion.
Custom Report Builder: Drag-and-drop interface for creating custom reports combining marketing, sales, and service data.
Best For
B2B companies and businesses with longer sales cycles where understanding the full customer journey matters. Especially powerful if you're already using HubSpot CRM or considering a unified platform approach.
Pricing
Included with HubSpot Marketing Hub Professional (starts at $800/month) and Enterprise tiers. Not available as standalone software—requires HubSpot platform subscription.
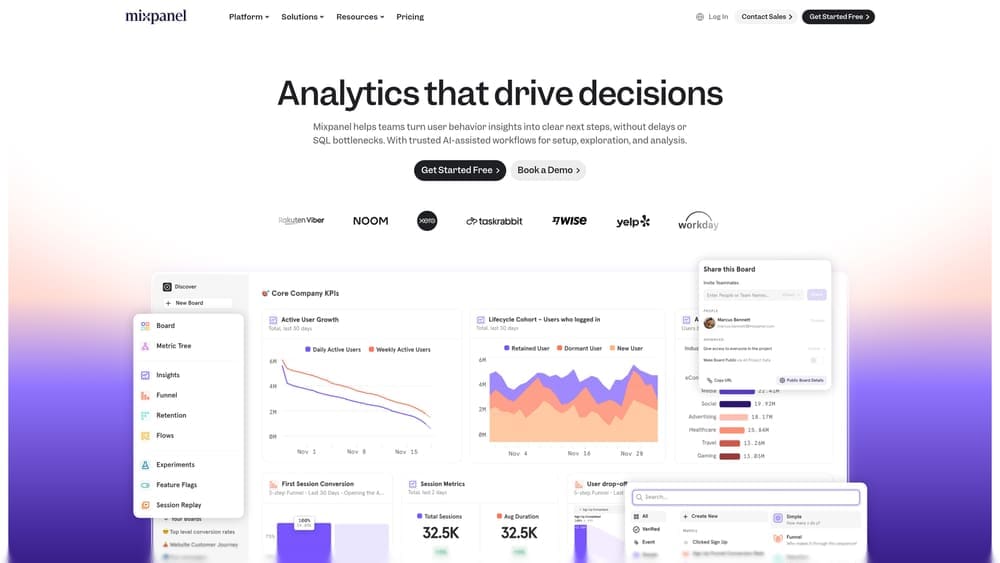
4. Mixpanel
Best for: Product analytics focused on user behavior and retention metrics
Mixpanel specializes in understanding what users actually do inside your product or application, making it essential for SaaS companies and digital product businesses.
Where This Tool Shines
Mixpanel's funnel analysis is exceptionally powerful. You can visualize exactly where users drop off in multi-step processes, compare conversion rates between user segments, and identify friction points that kill conversions. This level of insight is difficult to replicate with general-purpose analytics tools.
The cohort retention analysis is equally valuable. Instead of looking at aggregate user counts, you can track specific groups of users over time—like everyone who signed up in January—and see how their engagement evolves. This reveals patterns that aggregate metrics hide and helps you understand the long-term impact of product changes or marketing campaigns.
Key Features
Advanced Funnel Analysis: Visualize multi-step conversion processes with segment comparison and drop-off identification.
Cohort Retention Tracking: Monitor user groups over time to understand engagement patterns and retention drivers.
Real-Time Data Processing: See user behavior as it happens, enabling immediate response to trends or issues.
A/B Test Analysis: Built-in experiment tracking with statistical significance testing and impact measurement.
User Flow Visualization: Interactive path analysis showing how users navigate through your product.
Best For
SaaS companies, mobile app developers, and any business where user engagement inside a product drives success. Particularly valuable for product teams optimizing onboarding flows, feature adoption, and long-term retention.
Pricing
Free tier available for up to 20 million events per year. Growth plan starts at $20/month and scales based on event volume. Enterprise pricing available for high-volume needs.
5. Tableau
Best for: Advanced data visualization and business intelligence across multiple data sources
Tableau is the gold standard for data visualization, enabling sophisticated analysis without requiring SQL knowledge or coding skills.
Where This Tool Shines
Tableau's drag-and-drop interface makes complex analysis accessible. You can blend data from your CRM, advertising platforms, financial systems, and operational databases into unified dashboards that reveal insights invisible when data sources remain siloed. The visualization capabilities are unmatched—interactive charts, maps, and dashboards that make patterns immediately obvious.
The calculated field functionality is particularly powerful. You can create custom metrics and dimensions on the fly, enabling analysis that goes far beyond what your source systems provide. This flexibility means you're not limited to the reports your tools offer out of the box.
Key Features
Drag-and-Drop Visualization: Intuitive interface for creating complex charts and dashboards without coding.
100+ Data Source Connectors: Native integration with databases, cloud applications, spreadsheets, and marketing platforms.
Advanced Calculated Fields: Create custom metrics, ratios, and dimensions using a formula language.
Collaborative Dashboards: Share interactive reports with permission controls and commenting capabilities.
Mobile-Optimized Views: Automatically responsive dashboards that work seamlessly on tablets and phones.
Best For
Mid-size to enterprise businesses with complex data needs spanning multiple departments. Ideal for marketing teams that need to combine marketing data with sales, finance, or operational metrics for comprehensive business intelligence.
Pricing
Tableau Creator (full authoring capabilities) starts at $75 per user per month. Explorer (view and limited editing) at $42/user/month. Viewer (view only) at $15/user/month. Annual billing required.
6. Supermetrics
Best for: Automated marketing data extraction and centralization into reporting tools
Supermetrics solves the unglamorous but critical problem of getting data out of marketing platforms and into the tools where you actually analyze it.
Where This Tool Shines
The value proposition is simple but powerful: instead of manually exporting data from Facebook Ads, Google Ads, LinkedIn, your email platform, and a dozen other tools, Supermetrics does it automatically. You set up the connections once, define what data you want, and it flows into Google Sheets, Excel, Looker Studio, or your data warehouse on whatever schedule you specify.
This eliminates the most tedious part of marketing analytics—data collection—and ensures your reports always reflect current data without manual updates. For agencies managing multiple clients, this time savings is transformative.
Key Features
100+ Marketing Platform Connectors: Pre-built integrations with advertising, social, analytics, and marketing automation platforms.
Automated Data Refresh: Schedule automatic updates daily, hourly, or in real-time depending on destination.
Multiple Destination Support: Send data to Google Sheets, Excel, Looker Studio, BigQuery, Snowflake, and major BI tools.
Data Blending Capabilities: Combine metrics from multiple sources into unified reports.
Pre-Built Report Templates: Ready-made dashboards for common marketing reporting needs.
Best For
Marketing agencies managing multiple clients, in-house teams running campaigns across many platforms, or anyone spending significant time manually pulling data for reports. Particularly valuable when combined with Looker Studio or Google Sheets for visualization.
Pricing
Starts at $39/month per destination (e.g., one Google Sheets account or one data warehouse). Essential plan at $99/month adds more data sources and refresh frequency. Agency and enterprise plans available for higher volumes.
7. Looker Studio
Best for: Free, collaborative dashboard creation with real-time data visualization
Looker Studio (formerly Google Data Studio) provides professional-grade data visualization and reporting at exactly zero cost.
Where This Tool Shines
The fact that Looker Studio is completely free yet genuinely powerful makes it remarkable. You can create unlimited dashboards, share them with unlimited users, and pull data from hundreds of sources through native connectors and third-party integrations. For small businesses and startups, this removes the cost barrier to sophisticated reporting entirely.
The real-time collaboration features work like Google Docs—multiple team members can edit reports simultaneously, leave comments, and share insights. This collaborative approach to analytics is far more effective than static reports emailed as PDFs.
Key Features
Unlimited Free Reports: Create as many dashboards as needed without any usage limits or paywalls.
Native Google Integration: Seamless connection to Google Analytics, Google Ads, Search Console, and other Google products.
800+ Partner Connectors: Third-party connectors available for most major marketing platforms and databases.
Real-Time Collaboration: Multiple users can edit reports simultaneously with commenting and sharing features.
Embeddable Reports: Share dashboards via link or embed them directly in websites and internal portals.
Best For
Small businesses with limited budgets, marketing teams heavily invested in Google's ecosystem, or anyone who needs to create client-facing reports. Works particularly well when combined with Supermetrics for broader data source coverage.
Pricing
Completely free with no usage limits. Google account required. Looker Studio Pro (enhanced enterprise features) available as part of Google Cloud.
8. Adobe Analytics
Best for: Enterprise-grade analytics with advanced AI-powered insights and attribution modeling
Adobe Analytics represents the enterprise end of the analytics spectrum, offering sophisticated capabilities for large organizations with complex measurement needs.
Where This Tool Shines
Adobe's Sensei AI layer provides genuinely advanced insights that go beyond what most analytics platforms offer. Anomaly detection automatically identifies unusual patterns in your data—like a sudden traffic spike or conversion drop—and alerts you before small problems become big ones. The contribution analysis uses machine learning to identify which factors most influenced changes in your key metrics.
The segmentation capabilities are exceptionally powerful. You can build complex audience segments based on virtually any combination of behaviors, attributes, and calculated metrics, then apply those segments retroactively to historical data. This enables sophisticated analysis that's difficult or impossible with simpler tools.
Key Features
Adobe Sensei AI Insights: Machine learning-powered anomaly detection, contribution analysis, and intelligent alerting.
Advanced Segmentation: Build complex audience segments with unlimited criteria and retroactive application to historical data.
Real-Time Data Collection: Process and report on data as it's collected with sub-second latency.
Cross-Channel Attribution: Algorithmic attribution modeling that assigns credit across touchpoints based on actual impact.
Automated Insights: AI-generated explanations of metric changes and trend identification without manual analysis.
Best For
Enterprise organizations with significant web traffic, complex customer journeys, and the resources to fully leverage advanced analytics capabilities. Particularly valuable for companies already using Adobe Experience Cloud products.
Pricing
Custom enterprise pricing based on server calls (data volume), features required, and contract terms. Implementations typically start around $100,000 annually and scale significantly for high-volume organizations.
9. Databox
Best for: Executive KPI dashboards with mobile-first design and automated goal tracking
Databox focuses on making key metrics accessible to busy executives and managers who need at-a-glance performance monitoring rather than deep-dive analysis.
Where This Tool Shines
The mobile experience is where Databox truly differentiates itself. The iOS and Android apps provide genuinely useful dashboard access—not just desktop reports crammed onto a smaller screen. You can check your key metrics while traveling, get push notifications when goals are hit or missed, and quickly share performance snapshots with your team.
The goal tracking and scorecard features make it easy to set targets and monitor progress visually. Instead of digging through reports to see if you're on track, you get immediate visual feedback through color-coded scorecards that show performance against goals at a glance.
Key Features
Mobile-First Dashboard Design: Native iOS and Android apps optimized for on-the-go monitoring with push notifications.
70+ One-Click Integrations: Pre-built connectors for major marketing, sales, and analytics platforms with minimal setup.
Goal Tracking and Scorecards: Set targets for key metrics with visual indicators showing progress and performance.
Automated Performance Alerts: Receive notifications when metrics hit thresholds or show unusual patterns.
Benchmark Data: Compare your performance against industry averages from anonymized Databox user data.
Best For
Executives and managers who need high-level performance monitoring without diving into detailed analysis. Ideal for agencies providing client dashboards or distributed teams that need shared visibility into key metrics.
Pricing
Free tier available with 3 data sources and 3 users. Starter plan at $47/month includes 10 data sources and unlimited users. Professional at $135/month adds advanced features and more data sources.
Making the Right Choice
Your ideal analytics solution depends on three factors: your team's technical expertise, the complexity of your data, and whether you need strategic guidance or just tools.
If you're a service-based business that knows you need better analytics but lacks internal data expertise, Campaign Creatives provides the strategic guidance and custom implementation that turns data into decisions. For small businesses just starting their analytics journey, the combination of Google Analytics 4 and Looker Studio delivers powerful capabilities at zero cost.
Product-led companies and SaaS businesses should prioritize Mixpanel for its user behavior tracking and retention analysis—these insights are critical for product optimization. Enterprises with complex data spanning multiple departments will find Tableau or Adobe Analytics worth the investment for their advanced capabilities and cross-functional analysis.
Marketing agencies managing multiple clients benefit enormously from Supermetrics, which eliminates the tedious manual work of data collection and frees up time for actual analysis. And executives who need quick performance visibility without deep analysis will appreciate Databox's mobile-first approach and automated goal tracking.
The real challenge isn't collecting marketing data—it's turning that data into decisions that improve your results. The right analytics solution should make your marketing smarter, your budget more efficient, and your strategy more confident. Whether you choose a comprehensive platform, a specialized tool, or partner with experts who handle the complexity for you, the key is moving from data overwhelm to data-driven growth.
Ready to transform your marketing data into actionable insights? Learn more about our services and discover how custom analytics solutions can accelerate your business growth.
Campaign
Creatives
quick links
contact
© 2025 Campaign Creatives.
All rights reserved.