campaign
creatives

Top 8 How To Create Data-Driven Marketing Reports Tools To Transform Scattered Metrics Into Strategic Insights
Discover the leading platforms that show you how to create data-driven marketing reports by connecting fragmented data sources, automating tedious aggregation work, and presenting insights that actually inform decisions.
Your monthly marketing report is due tomorrow, and you're staring at twelve open browser tabs—Google Analytics, Facebook Ads Manager, HubSpot, Mailchimp, LinkedIn Campaign Manager. Each platform tells part of the story, but none of them talk to each other. You know the CMO wants to see how paid social contributed to pipeline growth, but connecting those dots means manually exporting CSVs, cleaning data in Excel, and building charts that'll be outdated by the time anyone reads them.
This is the reality for most marketing teams. The problem isn't lack of data—it's the absence of infrastructure to transform scattered metrics into coherent narratives that actually inform decisions. When your reporting process involves copying numbers between platforms and explaining why last month's "wins" didn't translate to revenue, you're not doing marketing analytics. You're doing data janitorial work.
The right reporting tool changes everything. It connects your fragmented data sources, automates the tedious aggregation work, and presents insights in formats that resonate with different stakeholders—whether that's a visual dashboard for executives or detailed attribution analysis for your performance team. We've evaluated the leading platforms based on integration capabilities, automation features, visualization quality, and real-world usability. Here are the tools that transform reporting from a monthly obligation into a strategic advantage.
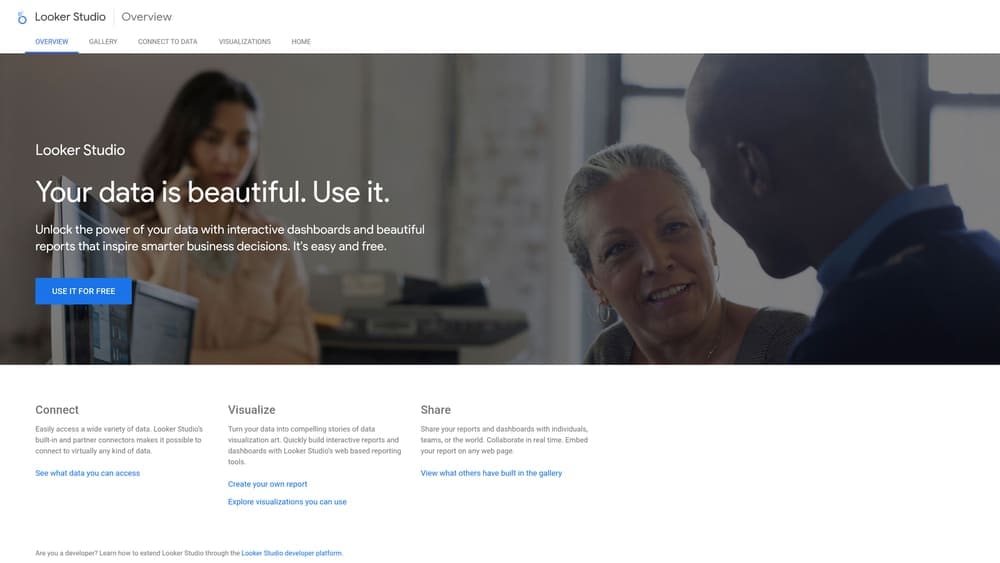
1. Google Data Studio (Looker Studio)
Best for: Marketers who need free, flexible reporting with deep Google ecosystem integration
Google Looker Studio (formerly Data Studio) remains the go-to choice for marketers seeking powerful reporting without budget constraints.
Where This Tool Shines
Looker Studio excels at democratizing data visualization for teams of any size. The drag-and-drop interface lets you build interactive dashboards without coding knowledge, while advanced users can leverage calculated fields and custom SQL queries for sophisticated analysis.
Real-time data connections mean your reports always reflect current performance, eliminating the manual refresh cycles that plague static reporting. The collaborative features mirror Google Workspace functionality—multiple team members can edit reports simultaneously, and sharing is as simple as sending a link with appropriate permissions.
Key Features & Capabilities
Native Google Integration: Seamlessly connects to Google Analytics, Google Ads, Search Console, and YouTube Analytics with one-click authentication.
Extensive Third-Party Connectors: Access 800+ data sources including Facebook Ads, HubSpot, Salesforce, and MySQL databases through partner ecosystem.
Interactive Viewer Controls: Date range selectors and filters let stakeholders explore data without editing permissions or breaking the report structure.
Calculated Metrics: Create custom formulas and blend data from multiple sources to build metrics your platforms don't provide natively.
Embedded Reporting: Share reports publicly via link or embed them in websites and internal portals with granular permission controls.
Best For / Ideal Users
Looker Studio is ideal for small to mid-sized marketing teams already invested in the Google ecosystem. The platform particularly benefits agencies managing multiple client accounts who need professional reporting capabilities without per-client software costs.
It's also valuable when you need to share reports with external stakeholders who shouldn't have direct access to your analytics platforms—the viewer permissions let them see insights without exposing sensitive account data.
Pricing
Completely free for standard use. Google offers Looker Studio Pro at $9/user/month for enterprise teams needing advanced features like team workspaces, SLA support, and enhanced data freshness controls.
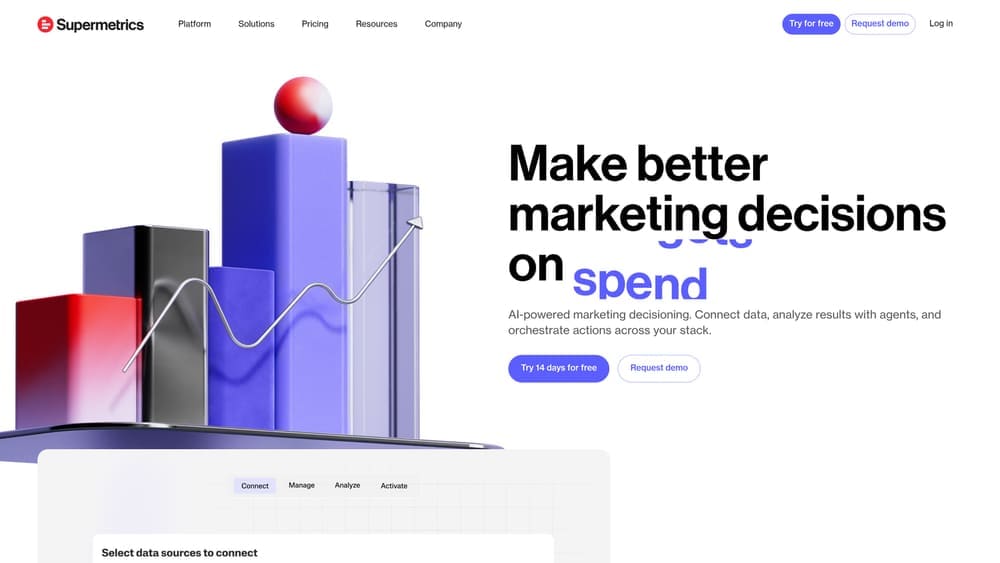
2. Supermetrics
Best for: Automating data transfers from marketing platforms into your preferred reporting environment
Supermetrics functions as the data pipeline that connects your marketing platforms to wherever you actually want to analyze and report on that data—whether that's Google Sheets, Excel, Looker Studio, Power BI, or your data warehouse.
Where This Tool Shines
Rather than building reports within its own interface, Supermetrics focuses on solving the data integration challenge that makes reporting painful. The platform pulls data from over 100 marketing and sales platforms through pre-built connectors that understand each platform's API structure and data schema.
The real power emerges when you need to preserve historical data beyond what platforms retain. Facebook Ads might only give you 28 months of data through their interface, but Supermetrics can backfill and continuously store that information in your chosen destination. This becomes critical when you're analyzing year-over-year trends or building attribution models that require long-term performance data.
Key Features & Capabilities
100+ Pre-Built Connectors: Direct integrations with major advertising platforms, analytics tools, social media channels, and SEO platforms eliminate custom API development.
Scheduled Automatic Refreshes: Set data to update hourly, daily, weekly, or on custom intervals so your reports always reflect current performance without manual exports.
Data Transformation Features: Clean and normalize data during transfer with built-in functions for currency conversion, date formatting, and metric calculations.
Multi-Account Support: Agencies can manage dozens of client accounts from a single dashboard, with data flowing to separate destinations for each client.
Flexible Destination Options: Send data to Google Sheets for simple reporting, Excel for offline analysis, data warehouses for enterprise BI, or directly into Looker Studio and Tableau.
Best For / Ideal Users
Supermetrics serves agencies juggling dozens of client accounts who need reliable data pipelines without building custom integrations for each client. The platform excels when you've already invested in business intelligence tools like Tableau or Power BI and need marketing data flowing into those systems.
Data-savvy marketers who prefer building custom reports in spreadsheets rather than using pre-built dashboard templates will appreciate the flexibility. You maintain complete control over how data is structured, visualized, and analyzed—Supermetrics just handles the extraction and loading.
Teams managing multiple brands or product lines benefit from the ability to consolidate data from numerous accounts into unified datasets. Instead of logging into five different ad platforms to compare performance, you can pull everything into a single spreadsheet with consistent formatting.
Pricing
Plans start at $69/month for essential features with single-user access. Professional plans begin at $99/month and scale based on the number of data sources and destinations needed. Enterprise pricing available for large organizations requiring advanced features and dedicated support.
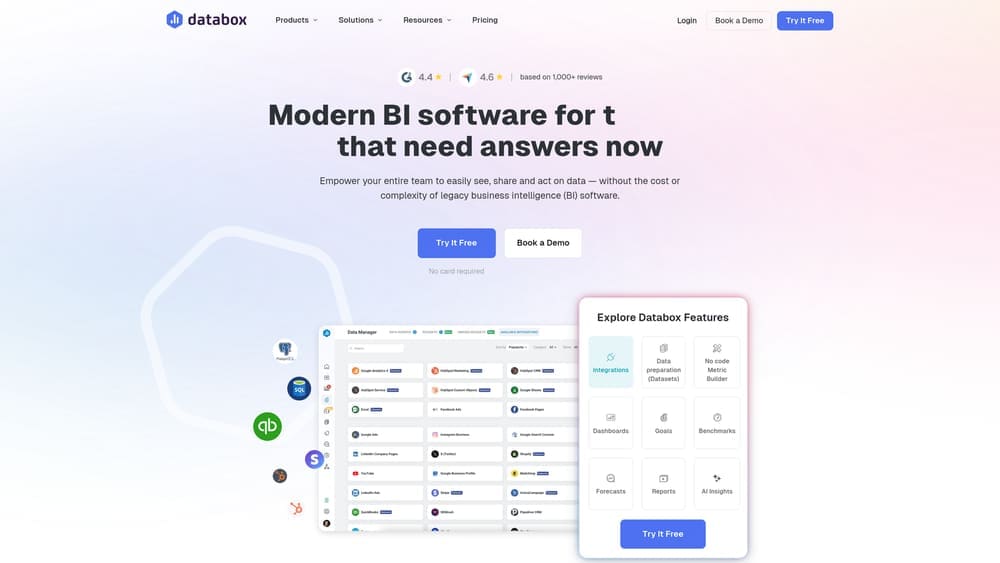
3. Databox
Best for: Creating mobile-friendly KPI dashboards that keep teams aligned on goals
Databox transforms marketing data into goal-oriented dashboards that emphasize performance against targets rather than just displaying raw metrics.
Where This Tool Shines
Databox distinguishes itself through its focus on goal tracking and performance monitoring rather than exploratory analysis. You set specific KPI targets, and the platform visualizes your progress with intuitive scorecards that use color coding and trend indicators to show whether you're on track.
The mobile app delivers push notifications when metrics hit important thresholds, keeping teams informed without requiring them to log into dashboards. This means your sales team gets alerted when lead volume drops below target, or your content manager receives a notification when organic traffic hits a new milestone—all without opening a laptop.
Pre-built dashboard templates for common marketing scenarios—like "Facebook Ads Performance" or "SEO Monthly Overview"—let you start reporting in minutes rather than hours. The Query Builder feature allows non-technical users to create custom metrics by selecting dimensions and measures through dropdown menus rather than writing code.
Key Features & Capabilities
130+ One-Click Integrations: Connect marketing, sales, and analytics platforms without technical setup or API configuration.
Mobile Apps for iOS and Android: Access dashboards on any device with push notification alerts for threshold breaches.
Goal Tracking with Visual Indicators: Set targets for any metric and see color-coded progress indicators showing whether you're on track.
Databoards for Office Displays: Create always-visible dashboards that can be displayed on office TVs or monitors for team visibility.
Automated Report Delivery: Schedule reports to be sent via email or Slack on custom schedules without manual intervention.
Benchmark Data: Compare your performance against industry averages to understand how you stack up against competitors.
Client Access Portals: Agencies can create branded portals where clients access their reports without needing separate logins.
Best For / Ideal Users
Databox works best for marketing teams that want to maintain constant visibility into performance without constantly checking multiple platforms. The mobile-first approach makes it ideal for managers who need to monitor KPIs while away from their desk.
Agencies benefit from the client portal functionality that lets them share reports with customers while maintaining control over data access and branding. The platform's focus on goal tracking rather than deep analysis makes it perfect for organizations that value quick performance checks over exploratory data analysis.
Pricing
Free plan available with limited data sources and users. Professional plans start at $72/month with expanded integrations and features. Agency and enterprise pricing available for larger organizations with advanced requirements.
4. Klipfolio PowerMetrics
Best for: Building custom metrics and KPIs from multiple data sources with a focus on business intelligence
Klipfolio PowerMetrics positions itself as a true business intelligence platform for marketers who need to go beyond standard platform metrics into territory where custom calculations drive strategic decisions.
Where This Tool Shines
PowerMetrics excels when your reporting needs extend beyond what platforms provide natively. The metric builder lets you create sophisticated formulas—calculating customer acquisition cost by dividing total marketing spend by new customers, or determining content ROI by comparing production costs against generated revenue.
Unlike tools that simply display data from connected platforms, PowerMetrics encourages you to define the specific metrics that matter to your business, then automatically calculates and tracks them. The data modeling capabilities mean you can join data from different sources—like combining CRM data with advertising spend to calculate true customer lifetime value by acquisition channel.
Key Features & Capabilities
Custom Metric Builder: Create complex calculations using formulas that combine data from multiple sources into single, trackable KPIs.
130+ Pre-Built Connectors: Connect to major marketing platforms plus REST API and SQL database connections for custom data sources.
Data Modeling Features: Join and blend data from different platforms to create unified datasets that reveal cross-channel insights.
Automated Anomaly Detection: Receive alerts when metrics show unusual changes that warrant investigation.
Collaborative Metric Discussion: Teams can comment on metrics and share insights directly within the platform.
Embedded Analytics: Integrate reports and metrics into your own applications for customer-facing or internal tools.
Version Control: Track changes to metrics and dashboards over time to understand how definitions evolve.
Best For / Ideal Users
Klipfolio serves data-savvy marketing teams that need to create custom metrics beyond what platforms provide natively. It's particularly valuable for organizations that want to connect marketing data to financial and operational systems for comprehensive business intelligence.
Companies that need to embed reporting capabilities into their own customer-facing applications will appreciate the white-label options and API access. Teams that value metric governance and want to maintain consistent definitions across the organization benefit from the version control and collaborative features.
Pricing
PowerMetrics offers a free tier with limited metrics and data sources for teams getting started. Paid plans start at $90/month and scale based on the number of metrics tracked and data sources connected. Enterprise pricing available for large organizations requiring advanced features and support.
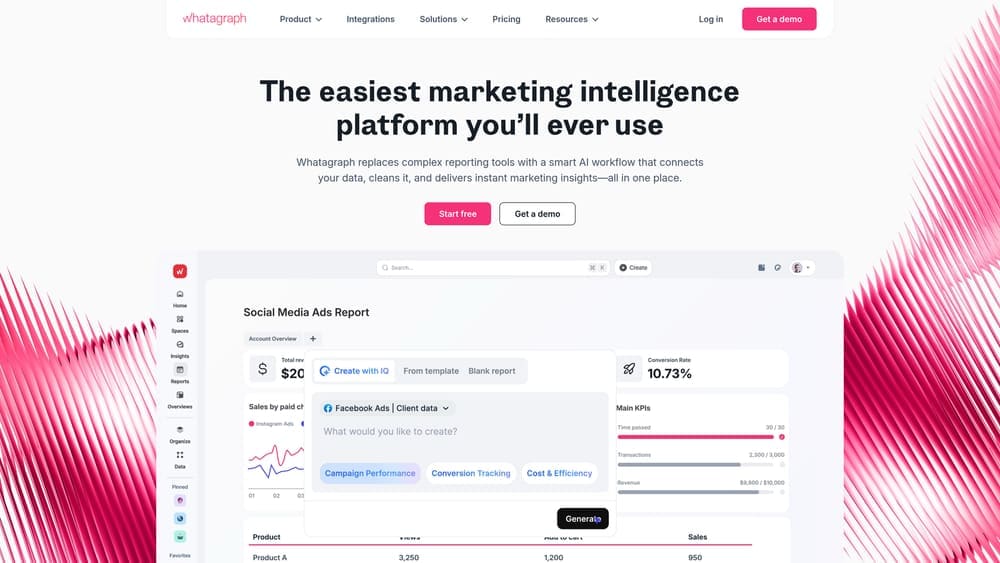
5. Whatagraph
Best for: Agencies and consultants who need white-labeled, client-ready reports with minimal setup time
Whatagraph is an AI-powered marketing intelligence platform that transforms complex marketing data into clear, branded reports specifically designed for agency workflows.
Where This Tool Shines
Whatagraph eliminates the repetitive work that drains agency productivity. Instead of rebuilding reports from scratch for each client, you work with pre-designed templates that automatically populate with data from connected sources. The platform understands common agency reporting scenarios—monthly performance reviews, campaign summaries, cross-channel overviews—and provides layouts that include appropriate visualizations and metric explanations.
The white-labeling goes deeper than most competitors. You're not just adding a logo to a generic template. Whatagraph lets you customize colors, fonts, and layouts to match your agency's brand guidelines, then apply those settings across all client reports. You can even use custom domains so reports appear to come directly from your agency rather than a third-party tool. This level of branding consistency matters when you're positioning yourself as a premium service provider.
Cross-channel reporting is where Whatagraph particularly excels. The platform connects data from paid social, organic search, email marketing, and website analytics into unified views that show how channels work together. This matters because clients don't think in channel silos—they want to understand total marketing performance and how their budget drives results across touchpoints.
Key Features & Capabilities
45+ Native Integrations: Direct connections to major advertising, analytics, and social platforms without third-party connectors.
Pre-Built Report Templates: Ready-made layouts for common marketing channel combinations that you can customize and reuse.
White-Label Customization: Add your agency branding, logo, color scheme, and custom domain to every report.
Automated PDF Generation: Schedule reports to generate and email automatically on your chosen cadence.
Client Portal Access: Give customers on-demand access to reports without requiring logins to multiple platforms.
Live Presentation Mode: Display reports during client meetings with real-time data updates.
Multi-Language Support: Create reports in different languages for international client bases.
Best For / Ideal Users
Whatagraph serves digital marketing agencies managing multiple client accounts who need consistent, professional reporting without dedicating hours to manual report creation. The platform works particularly well for agencies that bill retainer fees and need to demonstrate ongoing value through regular performance updates.
Freelance consultants benefit from the professional appearance that white-labeling provides, letting them compete with larger agencies on report quality. In-house teams that report to multiple stakeholders will appreciate the ability to create different report versions for different audiences without maintaining separate systems.
Pricing
Plans start at $223/month for agencies managing up to 10 data sources. Professional and custom enterprise plans available with expanded features and higher data source limits. 7-day free trial available to test the platform.
6. Tableau
Best for: Enterprise marketing teams needing sophisticated data analysis and visualization capabilities
Tableau represents the enterprise-grade business intelligence approach to marketing reporting, offering unmatched visualization capabilities and data analysis depth for organizations with complex reporting requirements.
Where This Tool Shines
Tableau's strength lies in its ability to handle massive datasets and create highly customized, interactive visualizations that reveal patterns invisible in standard reports. The platform's drag-and-drop interface makes it accessible to non-technical users, while its underlying calculation engine satisfies the requirements of data analysts and scientists.
You can create dashboards that let viewers drill down from high-level metrics into granular details, apply filters dynamically to explore different segments, and use statistical functions to identify correlations and trends. The visualization library extends far beyond basic charts—heat maps, scatter plots, geographic maps, and custom visualizations help you present data in the format that best communicates your insights.
Key Features & Capabilities
Extensive Data Connectivity: Connections to 100+ data sources including databases, cloud services, and files enable comprehensive data integration.
Advanced Analytics: Built-in forecasting, trend analysis, and statistical modeling capabilities transform descriptive reporting into predictive insights.
Interactive Dashboards: Drill-down functionality, filtering controls, and parameter adjustments let viewers explore data without editing reports.
Mobile Optimization: Layouts automatically adapt visualizations for phone and tablet viewing, ensuring accessibility across devices.
Natural Language Queries: Ask questions in plain English and receive instant visualizations, making data exploration more intuitive.
Best For / Ideal Users
Tableau serves enterprise marketing organizations with dedicated analytics teams who need to combine marketing data with financial and operational systems for comprehensive business intelligence. The platform excels when marketing reports inform strategic decision-making at the executive level and require sophisticated analysis beyond basic performance tracking.
Companies that need to identify complex patterns across multiple data sources, perform predictive modeling, or create highly customized visualizations will find Tableau's capabilities justify the investment. The platform works best when you have users who can dedicate time to learning its full feature set.
Pricing
Tableau Creator licenses start at $70/user/month (billed annually) and include full authoring capabilities. Viewer licenses for report consumers cost $15/user/month. Enterprise deployments typically involve significant implementation and training investments beyond software licensing.
7. AgencyAnalytics
Best for: Marketing agencies needing all-in-one client reporting with campaign management features
AgencyAnalytics is a comprehensive platform that combines automated client reporting with built-in campaign management tools, specifically designed for agencies managing multiple client accounts across various marketing channels.
Where This Tool Shines
AgencyAnalytics differentiates itself by integrating reporting with the operational tools agencies actually need to run their business. Beyond pulling data from marketing platforms, the system includes built-in rank tracking, call tracking, and uptime monitoring—capabilities that would typically require separate subscriptions. This consolidation means you're not juggling logins across five different tools just to compile one client report.
The platform's white-label customization extends far beyond slapping your logo on a template. You can customize the entire client portal with your branding, create custom domains, and modify report templates to match your agency's specific reporting methodology. The automated reporting engine can generate and deliver reports to dozens of clients simultaneously, each with their own data sources and customized layouts, eliminating the Friday afternoon scramble to get reports out before the weekend.
Key Features & Capabilities
80+ Marketing Platform Integrations: Connects to all major advertising, analytics, social media, and SEO platforms without requiring technical setup.
Built-in SEO Rank Tracking: Monitor unlimited keywords across search engines without needing a separate rank tracking subscription.
Call Tracking with Attribution: Track phone calls with recording capabilities and attribute them back to specific marketing campaigns.
Website Uptime Monitoring: Monitor client website performance and receive alerts when sites go down or load slowly.
Staff Activity Tracking: Log billable hours and track team member activities for internal project management.
Custom Branded Client Portal: Provide clients with a white-labeled portal where they can access reports on-demand using your agency's branding and domain.
Automated Report Scheduling: Set up reports to generate and deliver automatically on custom schedules without manual intervention.
Best For / Ideal Users
AgencyAnalytics targets digital marketing agencies that want to consolidate multiple tools into a single platform, reducing software costs and login complexity. It's particularly valuable for agencies that bill clients based on time and need integrated project management alongside reporting.
Marketing consultants who need professional reporting combined with campaign tracking capabilities will find the platform eliminates the need for separate tools. The system works especially well for agencies managing 5-20 clients where the per-client pricing model becomes cost-effective compared to enterprise platforms.
Pricing
Plans start at $12/month per client campaign with a minimum of $49/month. The freelancer plan supports up to 5 campaigns, while agency plans scale based on the number of client campaigns managed. 14-day free trial available.
8. Domo
Best for: Large enterprises needing to connect marketing data with company-wide business intelligence
Domo is an AI and data products platform that strengthens the entire data journey by connecting and moving data from any source, preparing and expanding data access for exploration, and accelerating business-critical insights.
Where This Tool Shines
Domo's enterprise focus means it handles data integration at a scale that smaller tools can't match. The platform connects to virtually any data source through its 1,000+ pre-built connectors and custom API integrations, then processes and visualizes that data in a unified environment.
For marketing teams, this means creating reports that show not just campaign performance, but how marketing activities impact sales pipeline, revenue, customer retention, and other business outcomes tracked in separate systems. The platform's data science features let you apply predictive analytics to forecast future performance based on historical trends. Domo's mobile app provides executive-level dashboards that give leadership instant visibility into marketing ROI alongside other business metrics.
Key Features & Capabilities
1,000+ Pre-Built Data Connectors: Connect marketing platforms with sales, finance, and operations systems in one environment.
ETL Tools for Data Preparation: Clean, transform, and normalize data from multiple sources before visualization.
AI-Powered Agents: Get instant answers to business questions through conversational AI interfaces.
Real-Time Processing and Alerting: Monitor business performance as it happens with automated notifications for threshold breaches.
Collaborative Workflows: Share insights, discuss findings, and coordinate actions directly within the platform.
Best For / Ideal Users
Domo serves enterprise marketing organizations that need to demonstrate how marketing contributes to overall business performance, not just marketing-specific metrics. It's ideal for companies where marketing reports need to sit alongside financial dashboards, operational metrics, and executive scorecards in a unified business intelligence environment.
The platform works best for organizations with dedicated analytics teams or data-savvy marketers who can leverage its advanced capabilities. Companies that need to combine marketing data with CRM systems, ERP platforms, and financial databases will find Domo's comprehensive integration capabilities particularly valuable.
Pricing
Domo uses custom enterprise pricing based on the number of users, data sources, and features required. Contact their sales team for specific quotes tailored to your organization's needs.
Putting It All Together
The right reporting tool depends entirely on your specific context. If you're working within the Google ecosystem and need powerful capabilities without budget constraints, Looker Studio delivers professional dashboards at zero cost. Agencies juggling multiple client accounts should look at Whatagraph or AgencyAnalytics—both eliminate the manual work of creating branded reports for dozens of clients each month. Enterprise teams connecting marketing performance to broader business outcomes will find Tableau or Domo worth the investment, especially when reporting needs extend beyond marketing into cross-functional analytics.
The common thread across successful implementations isn't the tool itself—it's the clarity about what questions your reports need to answer. Start by identifying the decisions your reports should inform, then choose the platform that makes those insights accessible to the people who need them. A dashboard that lives on someone's desktop but never influences strategy is just expensive decoration.
Data-driven marketing reports should accelerate decision-making, not document history. The tools we've covered transform raw metrics into strategic intelligence, but they require thoughtful implementation aligned with your team's workflow and stakeholder needs. Learn more about our services to discover how we help marketing teams build reporting systems that actually drive results, not just generate PDFs that get filed away.
Campaign
Creatives
quick links
contact
© 2025 Campaign Creatives.
All rights reserved.